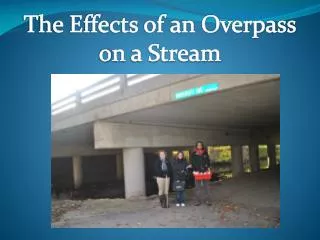
Stream Temperature Pattern and Process in the Trask Watershed Study: Pre-Harvest
260 likes | 421 Vues
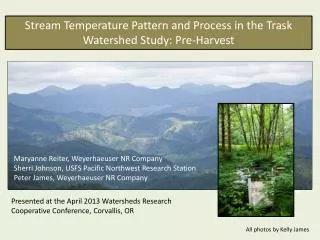
Stream Temperature Pattern and Process in the Trask Watershed Study: Pre-Harvest. Maryanne Reiter, Weyerhaeuser NR Company Sherri Johnson, USFS Pacific Northwest Research Station Peter James, Weyerhaeuser NR Company. Photo by Kelly James.

Stream Temperature Pattern and Process in the Trask Watershed Study: Pre-Harvest
E N D
Presentation Transcript
Stream Temperature Pattern and Process in the Trask Watershed Study: Pre-Harvest Maryanne Reiter, Weyerhaeuser NR Company Sherri Johnson, USFS Pacific Northwest Research Station Peter James, Weyerhaeuser NR Company Photo by Kelly James Presented at the April 2013 Watersheds Research Cooperative Conference, Corvallis, OR All photos by Kelly James
Outline Introduction • Provide landscape context of climatic variability in the Trask Watershed Study Area • Examine temperature variability within the watershed • Explore ways to account for variability in the treated watersheds • Based on what we learned pre-harvest, what do we expect post-harvest ?
Thermal Process Scales Introduction • Landscape: Latitude, continentality, altitude, orientation and exposure to regional circulation patterns. • Watershed: Elevation, aspect, cover (albedo), sun angle and streamflow (volume, depth and timing). • Reach: Canopy characteristics, aspect, gradient, stream width, streamflow generation mechanisms (e.g., springs)
Landscape Landscape Context of Trask Location, Location, Location
Landscape Trask Landscape Context: Sun and Rain PRISM Ave Annual Precipitation (in) DAYMET Ave Ann. Incident Solar Radiation PRISM Climate Group, Oregon State University, http://prism.oregonstate.edu, created 10 April 2013
Landscape Trask Summer Mean Max and Min Temps PRISM Mean July MIN Temp. (C) PRISM Mean July MAX Temp. (C) PRISM Climate Group, Oregon State University, http://prism.oregonstate.edu, created 10 April 2013
Watershed Trask Thermistor Locations
Watershed Trask Mean Maximum July Water Temperature
Watershed Trask Elevations Elevation is frequently used as a “proxy” to represent complex environmental gradients including: temperature, atmospheric moisture, winds, precipitation, incoming solar radiation, and air density. All these factors are important drivers of climate and ultimately stream temperature.
Watershed Elevation Variability with Climate
Watershed Longitudinal Behavior of Stream Temperature Conceptual behavior of stream temperature in the downstream direction Upstream temperature + weather is controlling Weather is controlling Upstream temperature is controlling Te Temperature Distance downstream T0 Distance downstream is also proxy for changes in elevation and drainage area Modified from Mohseni and Stefan (1999)
Watershed Longitudinal Behavior of Trask Temperature Beaver dams
Watershed Aspect Variability
Watershed Trask Aspect Example There was not a consistent aspect signal in the small watersheds
Watershed Geomorphic Variability
Watershed Geomorphic Example: Earthflows PH2 PH3
Watershed And Then There is Temporal Variability…
Watershed What Can We Learn From Temporal Variability? We used mean July maximum stream temperature data from a cool year (2011) to predict warm year temperatures (2009). Then took the residuals (this graph only shows the study sites) to see which stream are warmer than would have been predicted (e.g., Gus mouth, UM3) and those that are cooler (Pothole CE, PH2 and PH4). Red are downstream sites and yellow are small watersheds
Reach July Mean MAX Temp and Channel Metrics
Reach Small Watershed Stream Flow and Temperature (l/s) We did not find a strong connection between streamflow and stream temperature when we examined individual small streams. This may be due to the fact that the flows are extremely low with some streams barely flowing.
Harvest Treatments Treatment Effects • Clearcut harvest with buffer • Clearcut harvest with leave tree retention • Clearcut harvest with no leave trees • Thinning with buffer
What do we Expect to Change? Treatment Effects Timber harvest can effect the microclimate of a site by removing the canopy. Harvest can reduce shade which can increase radiative heat flux into the water and also indirectly increase air temperature above the water. Removing trees also reduces wind sheltering which can cause increased wind speeds and increased convective and evaporative cooling. For those sites that show response prior to harvest to air temperature and wind, we would expect them to show more of a response following harvest.
Predicting Effects: Climatic Sensitivity Treatment Effects Examples of small watershed responses to wind speed (sheltering) and air temperature (proxy for shading). We would expect sites such as PH1 to be more sensitive to changes in shading and sheltering since it was sensitive prior to harvest. PH2 appears less thermally sensitive.
Accounting for Variability Analysis UM3 example.. proximity does not confer process Treatment Watersheds Red number is correlation to reference subbasin in cluster, black bold number is where correlation of other reference sites are higher than the cluster site Reference Watersheds
Trask Temperature Patterns Summary • The Trask Watershed Study summer stream temperatures, especially in the small streams, are highly variable. • This variability can only partially be explained by watershed parameters such as elevation and aspect due to complex environmental parameters that govern local temperature sensitivity. • Even though temperature varies throughout the Trask there are ways to account for the variability. • In attempting to understand the drivers of pre-harvest thermal patterns, we can, at least conceptually, anticipate the response of small streams to harvest.
Link to the Biology Summary (cont.) Since there are a multitude of temperature metrics, how we analyze the data will ultimately depend on the objectives. Riparian vegetation Birds Light Leaf litter, Detrital matter Invertebrates Temperature Geo- morphology Amphibians Nutrient availability Primary producers (algae, diatoms) Fish Turbidity, Sus. sediment Hydrology