Download

1 / 19
200 likes | 332 Vues
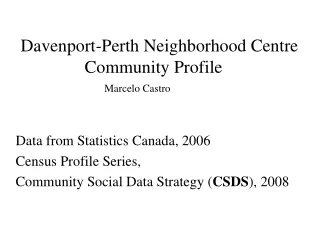
Davenport-Perth Neighborhood Centre Community Profile. Marcelo Castro. Data from Statistics Canada, 2006 Census Profile Series, Community Social Data Strategy ( CSDS ), 2008. Context: Strategic Direction on Poverty Reduction (2009-2011). OUTCOMES.

E N D
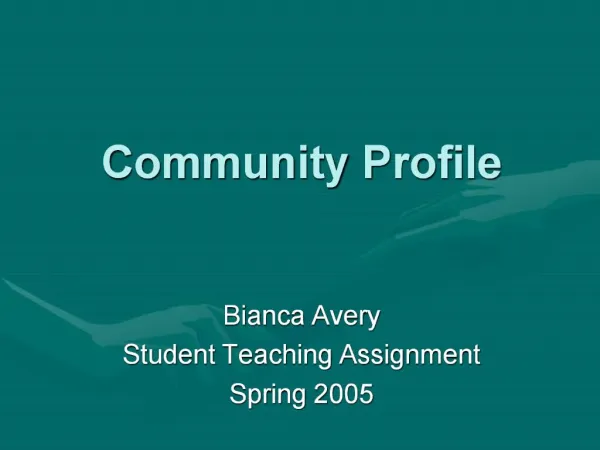
Davenport-Perth Neighborhood Centre Community Profile Marcelo Castro Data from Statistics Canada, 2006 Census Profile Series, Community Social Data Strategy (CSDS), 2008
Context: Strategic Direction on Poverty Reduction (2009-2011) OUTCOMES We will engage with our community in action and advocacy to address the causes of poverty Increased capacity to carry out advocacy Increased knowledge about poverty needs, gaps and ways to respond Knowledge Building Education & Awareness Consolidated research and analysis Increased staff awareness Integrated community education and learning approach Identified and prioritized issues for action Increased community engagement Strengthened internal and external collaborative links to community engagement strategies Advocacy Programs/ Services / Policy Development FOCUS INDICATORS
Implementation Strategy Research capacity to inform issues to focus What stories can we tell about the impact of poverty on the lives of the various populations we serve? Research & Education Outreach and mobilization strategies to raise awareness about issues, develop actions to address causes of poverty, and engagement to support poverty reduction strategies Community Engagement Long-term strategies to increase community capacity to address causes of poverty and affect changes at systemic level Community Organizing Develop capacity to create services to help community to have access to financial services/support and hold community accountable to policy development and implementation Community Accountability
Progress to Date: Knowledge Building • 11 focus groups with 126 participants across programs; • Causes of poverty, links to health and opportunities for action; Different realities of poverty manifestation explored • Services needs and issues indentified (Financial Literacy, EI and SA information) • Clientele Survey and Data Basis to track poverty indicators • Income & support program, immigration, ethnicity/race, education, language, neighborhood & housing, employment, • Catchment socio-economic profile
Demographic Highlights for DPNC’s Catchment • 56.126 people lived in our catchment in 2006 • Average population growth = - 5.09 % • Our catchment is in the 2nd most diverse ridingin Ontario • 54% of the total population is made up of immigrants • 12% of immigrants are newcomers arriving between 2001-2006 • 19,085 individuals (34% of total population) are members of visible minority groups • Median Income of persons 15 years and older is only $20.465 • Average 46% of tenants households pay 30% or more in rent • Less than 1/3 the of population 25-64 years of age have education beyond high school level.
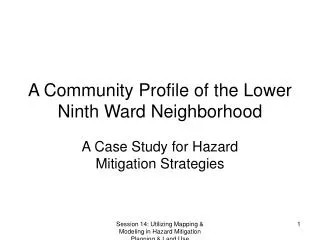
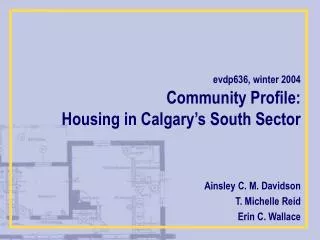
Catchment's Boundaries and Census Tracks (CTs) Census Tracks (CTs) are a geographic region defined for the purpose of taking a census; usually with a population between 2500&8000 Our catchment includes 12 census tracks (CTs) DPNC
Top 5 regions of birth of recent immigrants (2001-2006) Eastern Asia Southern Asia South America Southern Europe Southeast Asia
Top Visible Minority Groups in the Catchment • Black (24% ) • Latin American (20.50%) • South Asian (18%) • Chinese (15%) • Southeast Asian (7%) • Filipino (4.3%)
Median income, persons 15 years and over ($) Catchment’s Median = 20,465
Proportion of economic families with low income (%) 10.60 % - 20.50 % 20.60% - 25. 00 % More than 25%
Proportion of unattached individuals 15 years and over with low income (%)
Education: A major challenge to overcome poverty barriers in our catchment
Strategic Reflection • What do we need to know about the community we serve? • Where have you gone for answers? • How could the Community Profile or its data source help us to get these?