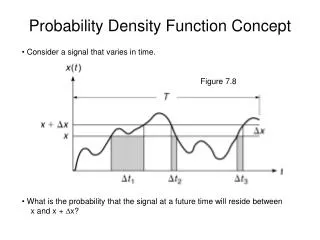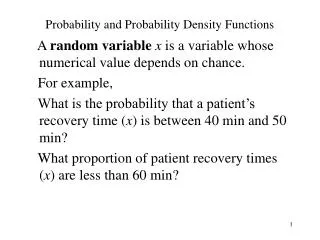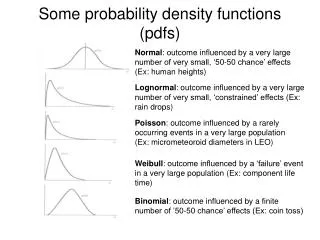
Probability Density Function (pdf) continuous distributions
Probability Density Function (pdf) continuous distributions. f(x) >= 0 all x f(x) is the “likelihood” of x integral under f(x) is exactly 1.0. Cumulative Distribution Function (cdf). F(x)=Pr(x<=X) probability X is <= x area under pdf from -inf up to x. FREQUENCY TABULATION .

Probability Density Function (pdf) continuous distributions
E N D
Presentation Transcript
Probability Density Function (pdf) continuous distributions • f(x) >= 0 all x • f(x) is the “likelihood” of x • integral under f(x) is exactly 1.0
Cumulative Distribution Function (cdf) • F(x)=Pr(x<=X)probability X is <= x • area under pdf from -inf up to x
FREQUENCY TABULATION • Interval Freq Rel Cum • Freq Prob • 40-44 22 .11 .11 • 44-48 46 .23 .34 • 48-52 74 .37 .71 • 52-56 52 .26 .97 • 56-60 6 .03 1.00
INTERPOLATION FORMULA for FRACTILE given cumulative probability xk = left end-point of interval xk+1 = right end-point of interval pk = cum prob at left end-point of interval pk+1 = cum prob at right end-point of interval p = given cum prob between pk and pk+1
INTERPOLATION FORMULA for cumulative probability given x xk = left end-point of interval xk+1 = right end-point of interval pk = cum prob at left end-point of interval pk+1 = cum prob at right end-point of interval x = given variable value between xk and xk+1
MEAN VALUE FORMULA for HISTOGRAM DISTRIBUTION • Interval Mid-points • mk = (xk + xk+1)/2 • Interval Probabilities • pk = Pk+1 - Pk • Mean Value • µ=Sum of pk * mk =
VARIANCE FORMULA for HISTOGRAM DISTRIBUTION • AVERAGE of x2 for each interval • mi2 = (xi2 + xixi-1 + xi-12)/3 • SECOND MOMENT • Sum of pi mi2 • VARIANCE • σ2=Second Moment - (mean)^2 • STANDARD DEVIATION • sqrt(Variance)
Example Computations • MEAN = .11*42 + .23*46 + .37*50 +.26*54 + .03*58 = 49.48 • SECOND MOMENT • VARIANCE