Download

1 / 36
530 likes | 1.5k Vues
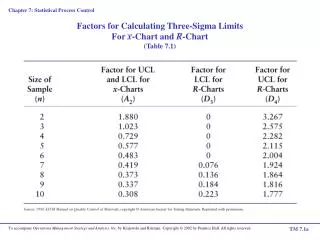
Chapter 5. Methods and Philosophy of Statistical Process Control. Basic SPC Tools. In statistical control: a process operating with only chance causes of variation Out of control: a process operating in the presence of assignable causes. A control chart contains A center line

E N D
Chapter 5. Methods and Philosophy of Statistical Process Control
In statistical control: a process operating with only chance causes of variation • Out of control: a process operating in the presence of assignable causes
A control chart contains • A center line • An upper control limit • A lower control limit • A point that plots within the control limits indicates the process is in control • A point that plots outside the control limits is evidence that the process is out of control • There is a close connection between control charts and hypothesis testing
Photolithography Example • Important quality characteristic in hard bake is resist flow width • Process is monitored by average flow width • Sample of 5 wafers • Process mean is 1.5 microns • Process standard deviation is 0.15 microns • Note that all plotted points fall inside the control limits • Process is considered to be in statistical control
Shewhart Control Chart Model w: sample variable μw: mean of w δw:standard deviation of w L: distance in terms of δw
More Basic Principles • Charts may be used to estimate process parameters, which are used to determine capability • Two general types of control charts • Variables (Chapter 5) • Continuous scale of measurement • Quality characteristic described by central tendency and a measure of variability • Attributes (Chapter 6) • Conforming/nonconforming • Counts • Control chart design encompasses selection of sample size, control limits, and sampling frequency
Types of Process Variability • Stationary and uncorrelated data vary around a fixed mean in a stable or predictable manner • Stationary and autocorrelated successive observations are dependent with tendency to move in long runs on either side of mean • Nonstationary process drifts without any sense of a stable or fixed mean
Reasons for Popularityof Control Charts • Control charts are a proven technique for improving productivity. • Control charts are effective in defect prevention. • Control charts prevent unnecessary process adjustment. • Control charts provide diagnostic information. • Control charts provide information about process capability.
3-Sigma Control Limits Probability of type I error is 0.0027 Probability Limits Type I error probability is chosen directly For example, 0.001 gives 3.09-sigma control limits Warning Limits Typically selected as 2-sigma limits
Sample Size and Sampling Frequency Average Run Length (ARL): Average number of points plotted before a point indicates an out of control condition p: probability any point exceeds control limits Average time to signal (ATS) h: in hours
Rational Subgroups • Rational subgroup: subgroups or samples should be selected so that if assignable causes are present, chance for differences between subgroups will be maximized, while chance for difference due to assignable causes within a subgroup will be minimized. • Two general approaches • Sample produced at the same time consecutive units • Sample representing all units produced since last sample • Often used to make decisions about acceptance of product • Effective at detecting shifts to out-of-control state and back into in-control state between samples • Care must be taken because we can often make any process appear to be in statistical control just by stretching out the interval between observations in the sample.
Analysis of Patterns on Control Charts • Pattern is very nonrandom in appearance • 19 of 25 points plot below the center line, while only 6 plot above • Following 4th point, 5 points in a row increase in magnitude, a run up • There is also an unusually long run down beginning with 18th point
Assume k decision rules. αi = probability of type I error under rule i α= overall type I error probability when k decision rules are independent.
Phase I and Phase II of Control Chart Application • Phase I: Retrospective analysis of process data to construct trial control limits • Effective at detecting large, sustained shifts in process parameters, outliers, measurement errors, data entry errors, etc. • Facilitates identification and removal of assignable causes • In phase II: Process monitoring • Process assumed to be reasonably stable • Emphasis on process monitoring, not on bringing an unruly process into control
THE “MAGNIFICENT SEVEN” • Histogram or stem-and-leaf plot • Check sheet • Pareto chart • Cause-and-effect diagram • Defect concentration diagram • Scatter diagram • Control chart
Check Sheet
Pareto Chart
Cause-and-Effect Diagram causes effects
Nonmanufacturing Application of SPC • Nonmanufacturing applications do not differ substantially from industrial applications, but sometimes require ingenuity • Most nonmanufacturing operations do not have a natural measurement system • The observability of the process may be fairly low • Flow charts and operation process charts are particularly useful in developing process definition and process understanding. • Used to identify value-added versus nonvalue-added activity