Download
1 / 37
440 likes | 1.45k Vues
Detection of Glutathione By Heat-Induced Surface-Enhanced Raman Scattering (SERS) and Electrochemical Sensing . Literature Seminar . Thabiso Musapelo 03-01-10. Objective. To improve the simplicity, selectivity and sensitivity of Glutathione detection.

E N D
Detection of Glutathione By Heat-Induced Surface-Enhanced Raman Scattering (SERS) and Electrochemical Sensing Literature Seminar Thabiso Musapelo 03-01-10
Objective • To improve the simplicity, selectivity and sensitivity of Glutathione detection. 1.“Development of a Heat-Induced Surface-Enhanced Raman Scattering Sensing Method for Rapid Detection of Glutathione in Aqueous Solutions” 2. “Electrochemical Sensing Strategy for Ultrasensitive Detection of Glutathione (GSH) by Using Two Gold Electrodes and Two Complementary Oligonucleotides “
Outline • Introduction • What is Glutathione ? • Surface enhanced Raman Scattering • Electrochemical Sensing • Results and discussion • Heat-induced Surface Enhanced Raman Scattering Method • Electrochemical Ultrasensitive Sensing Using modified Gold Electrode. Critique/Comparison Conclusion
Glutathione (GSH) • A tripeptide of glutamate, cysteine and glycine • (γ-L-glutamyl-L-cysteinylglycine; GSH) > 90 % • Has four different acid dissociation with the following pK`s : • 1. pK = 2.05 (glutamic acid) 2. pK = 3.40 (COOH, glycine) • 3. pK = 8.72 (-SH) 4. pK = 9.49 (amino group)
Glutathione (GSH) • Most abundant reductive thiol in cells • Serves as an antioxidant for the cells. • Bioreductive reactions • enzyme activity maintenance • Amino acid transport • Abnormally low levels in Cervical cancer, Diabetes, liver diseases • Over expressed in tissues • Alzheimer, Parkinson`s diseases
Detection Methods for GSH • Mass Spectrometry • Fluorescence Spectroscopy LOD = 16 nM • Electrochemical detection LOD = 10 nM
Difficulties in Detecting Glutathione • Interference of complex compounds • Sample preparation • Derivatization • Sensitivity • e.g. enzymatic • Poor Reproducibility • Low enhancement factor – Raman detection
Development of a Heat-Induced Surface-EnhancedRaman Scattering Sensing Method for RapidDetection of Glutathione in Aqueous Solutions Genin Gary Huang, Xiao X. Han, Mohammad Kamal Hossain, and Yukihiro Ozaki Anal. Chem. 2009, 81, 5881–5888
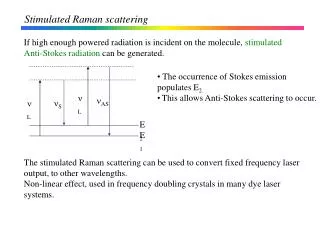
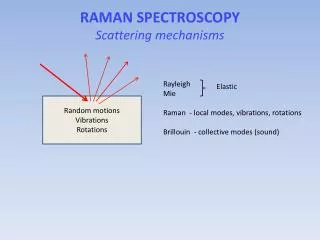
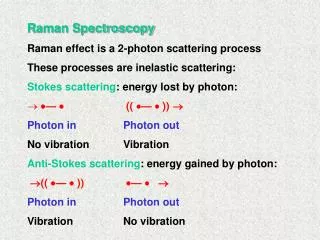
Raman Effect • Discovered in 1928 by Indian physicist C. V. Raman • Light inelastic scattering process; occurs at wavelengths that differ from that of incident light • Vibrational changes
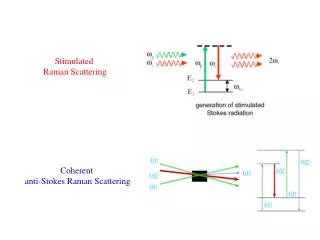
Theory of Raman Spectroscopy 2 Lowest Excited Electronic States 1 0 Virtual States Stokes λ>λ0 λ0 Anti-Stokes λ<λ0 λ0 2 Ground State Vibrational Energy States 1 DE 0
Surface-Enhanced Raman Scattering (SERS) Mechanism • Enhancement of local electromagnetic field at a surface of metal. • EF=> x106 • Chemical contribution due to the charge transfer between metal and sample molecule. EF => x102 Incident light SERS Signal Molecule Plasmons metal
Experimental • Aluminum pan plates • 50 ml of 10 mM Citrate Buffer (pH = 4.0) • NIR laser (785 nm) • laser spot size (10 μm), Power (15 mW) • Exposure time (1 s) • Scanning Electron Microscopy (SEM)
Preparation of the Silver Nanoparticles Colloidal Solution 1% C6H5Na3O7(10 ml) (3x) H2O distilled (0.5 L) AgNO3 Soln. AgNO3 (90 mg) Hot plate reduced AgNP`s colloidal Soln UV/vis spectrometer Ice bath
Characteristics Silver Colloidal nanoparticles 10 x dilution
Characteristics Silver Colloidal Nanoparticles • Absorption intensity • Absorption maximum wavelength
SERS with Different Pretreatments GSH (10 μM) , Reduction 15 min , pH 4.0 a) Heat-Induced method (3 min) b) Dry film method (90 min) c) No Treatment d) Raman Spectrum 0.5 M GSH, no Ag Colloids e) Blank Test
SEM Images of GSH mixed with Silver Colloids No Pretreatment Dry film method Heat-Induced method Blank Test
Effects of Silver Particle Size (15 min) (60 min)
Effects of the Amounts of Silver Colloids 5 min to dry => 60 μL 10 min to dry => 100 μL
SERS Glutathione Calibration Raman Intensity at 660 cm -1 (Arb. Unit) concentration (μm)
Electrochemical Sensing Strategy for Ultrasensitive Detection of GSH by Using Two Electrodes and Two Complementary Oligonucleotides Peng Miaoa, Lei Liua, Yongjun Niea, Genxi Li Biosensors and Bioelectronics, 2009
Three Electrode system Current supply v A Counter electrode Working electrode Reference electrode
Chronocoulometry (CC) Anson plot • Electrode Surface Area • Diffusion Coefficients • Concentration • Adsorption
Experimental • Electrochemical Analyzer, CHI660B (room temp.) • probe 1: 5`-HS-(CH2)6-TCCTATCCACCTATCC-3` • probe 2: 5`-HS-(CH2)6-TTTTTTTTGGATAGGTGGTACGA-3` • Three Electrode System • Gold electrode, saturated calomel and platinum auxiliary electrode • [Ru(NH3)6] 3+ used as electrochemical species
Ultrasensitive Detection of GSH 1 l GSH ) MCH
Ultrasensitive Detection of GSH RuHex AuNP GSH
Quantitative Detection of GSH - Chronocoulometry Anson plot • 0 pM, (b) 1 pM, (c) 10 pM, (d) 30 pM, (e) 50 pM, • (f) 80 pM, (g) 100 pM, (h) 200 pM, (i) 1000 pM
Calibration Curve for GSH Concentration y = 0.65809 + 0.00886x r = 0.99634, 3σ = 0.4 pM
Critique • No real world samples detected • Small dynamic range • Takes many hours
Conclusion Electrochemical Sensing • Relies on released DNA by GSH – Indirect method. • Amplification of Electrochemical signal by AuNPs. • Success in determination of GSH in fetal calf serum. Heat-Induced SERS • Relies on heated GSH mix with Silver colloid solution. • With all the parameters optimized, it takes short detection time.
Acknowledgments • Dr. Murray • Murray Research Group • Audience