Download

1 / 18
180 likes | 193 Vues
An overview of a watershed assessment studying Detroit River phosphorus loads to Lake Erie. Key findings, study area, contributors, models used, and load estimation methods are discussed. The report and supporting documents are available online.

E N D
Watershed Assessment of Detroit River Loads to Lake Erie Brief overview of key findings
Project overview TEAM: Don Scavia, Jen Read , Awoke Dagnew, Becca Muenich, BrankoKerkez, Yao Hu, SergheiBocaniov, Colleen Long, Yu-Chen Wang, Lynn Vaccaro, FUNDING: Erb Family Foundation ADVISORY GROUP: 30 people from US and Canadian government, non-profit, industry, and academic sectors provided feedback throughout entire project Report (released May 2019) and supporting documents available at: myumi.ch/detroit-river
Why this study was needed Detroit River Lower P concentration Higher discharge 41% of TP load to western basin 25% of TP load to whole lake • Lake Erie Harmful Algal Blooms (HABs) and hypoxia (low oxygen) are driven by phosphorus inputs. • US and Canada signed a revised Great Lakes Water Quality Agreement in 2012 that led to new loading targets and action plans to reach them. • Targets include a 40% reduction (relative to 2008 levels) in western and central basin TP loads. • There has been uncertainty about the role of the Detroit River, sources of Detroit River nutrients, and managing Detroit river loads. Maumee River Higher P concentration Lower discharge 48% of TP load to western basin 29% of TP load to the whole lake TP= Total Phosphorus, which includes dissolved and particulate forms of P
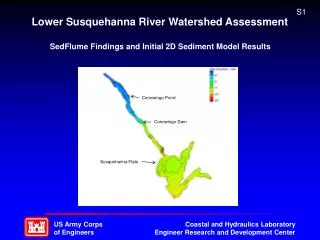
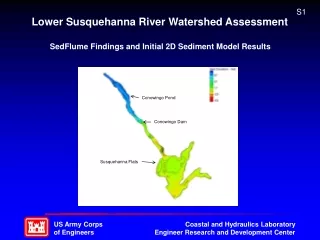
Study area: the St. Clair-Detroit River System • 19,040 km2 watershed • ~40% in Michigan and ~60% in Ontario • 49% cropland, 21% urban, 13% forest, 7% grassland, 7% water bodies • 79% of the agricultural land is in Ontario • 83% of the urban land is in Michigan • Lake St. Clair processes water and nutrients from Lake Huron (via the St. Clair River) and its proximate 15,000 km2 watershed
Study approach Four models were used to estimate loads and assess opportunities for load reduction A total phosphorus mass balance model for all inputs and outputs A watershed model simulating flow and dynamics of water, nutrients, and sediments A 3D coupled hydrodynamic and ecological model of Lake St. Clair An urban model simulating the sewer service area in the metro Detroit area
Estimating total phosphorus contributions Non-point source loads calculated using flow and phosphorus measurements from gauge stations for each sub-watershed, direct drainage area, and Lake Huron. Point source loads (including CSOs) calculated from EPA and MOECC data bases.
Where is phosphorus coming from? TP contributions from sub-watersheds TP contributions from primary source types • Lake Huron contributes about half of all P coming from this watershed. • Point source and non-point source contributions are nearly equal. • The Great Lakes Water Authority Water Resource Recovery Facility (GLWA WRRF) in Detroit contributes more than any individual sub-watershed and more than all other point sources combined. • Note: This is based on average loads for a 4-year period from 2013 – 2016 and does not take into account any processing of nutrients in Lake St Clair
Phosphorus from Lake Huron • TP inputs to Lake St. Clair measured at Algonac and Port Lambton (black line) are greater than the measured TP out of Lake Huron plus St. Clair River PS and NPS contributions (gray line). • This unmeasured load is likely from large sediment resuspension events in Lake Huron that evade detection at Point Edward and Point Huron monitoring sites. • This unmeasured load was also identified by Burniston et al. (2018). • The unmeasured load has increased over time, consistent with decreased ice cover and increased storms in Lake Huron.
Detroit River TP loads to Lake Erie • Our estimate for 2008 is considerably higher than what was used to set the targets (Maccoux et al. 2016). • Maccoux et al. underestimates likely due to their of a low value for the Lake Huron load. Detroit River TP load (MTA)
Lake St. Clair is a TP sink TP input to and output from Lake St. Clair annually • On average between 2001 and 2015, Lake St. Clair retained 20% of its TP inputs (with substantial inter-annual variability). • Sediment deposition in the 30% of lake deeper than 5m likely contributes to the retention. • Zebra and quagga mussels also likely contribute. • DRP measurements are less reliable, but annual retention appears to be much lower, possibly approaching 0. Percent difference line corresponds with right y-axis only, not MTA axis.
The role of Lake St Clair • Some of the TP from sources upstream of Lake St. Clair will be retained and not reach the Detroit River or Lake Erie. • This tends to increase the relative importance of sources below Lake St. Clair. This shows contributions after accounting for retention in Lake St Clair
How have inputs changed over time? • 2008 Detroit River TP load estimate: 3,096 MTA • 40% reduction means target for the Detroit River is 1,858 MTA. • Detroit River load has already declined to 2,425 MTA (2013-2016 average load), mostly due to decreases in the loads from Lake Huron and the WRRF. • 567 MTA remain to be reduced. Note: These numbers are based on the load estimates generated by the project team and have not been adopted for official use.
51% Percent reduction needed to hit 40% target 23% • An additional 23% reduction from all sources is needed to meet the loading target. • If there are no reductions to the Lake Huron load, a 51% reduction would be required from the remaining watershed sources. • If there are no further reductions from the GLWA WRRF andnone from Lake Huron, a 72% load reduction would be needed from the remaining sources. • Reducing Lake Huron load and GLWA WRRF loads each by 10-15% leaves 40-50% to be reduced from other watershed sources (which simulations show is possible). 72%
Options for reducing nonpoint sources Modeling results for scenarios with a combination of practices applied on all crop lands • Even with 100% adoption, none of the practices implemented alone achieved a 40% load reduction at their subwatershed’s outlet. • Bundling practices works better than implementing single practices. • Combining practices such as cover crops, filter strips, wetlands, and subsurface placement of fertilizer resulted in TP reductions >50%. • CC-PL bundle performed almost as well as CC-PL-Rate, suggesting it may not be necessary to adjust application rate if cover crops and subsurface placement are implemented. CC = cover crops FS = filter/buffer strips WT = wetlands PL = subsurface placement of fertilizer Rate = 25% reduction of application rates
Options for reducing nonpoint sources While Ontario fertilizer application is higher and tile drain spacing is more intense … … it is more likely that higher rainfall and different soil characteristics explain the higher loss yields compared to Michigan. Focusing practices on land with the highest phosphorus losses (55% of total land, instead of 100%) resulted in reductions approaching those achieved by applying practices on all agricultural land. CC = cover crops FS = filter/buffer strips WT = wetlands
Options for reducing point sources Changes in the phosphorus load from the Great Lakes Water Authority Water Resource Recovery Facility (GLWA WRRF) in Detroit • Point sources contribute 43% of the TP watershed load, and CSOs contribute less than 4%. • GLWA WRRF is 54% of the point source TP load and 13% of the Detroit River’s load to Lake Erie. • GLWA WRRF has already reduced its load by 51% since 2008. • While reductions from any one of the ~150 other point sources will not have a substantial impact, collectively they could help.
Summary of key findings • Over 50% of the Detroit River TP load comes from Lake Huron. • On average, Lake St. Clair retains 20% of the TP that enters the lake. • Model simulations suggest bundles of agricultural practices could be used to exceed load reduction targets from individual sub-watersheds, but applying single practices alone did not. • Targeting agricultural practices on just the 55% of land with the highest loss yields is nearly as effective as putting practices on 100% of land in some cases. • The WRRF in Detroit contributes 23% of the watershed load (not including Lake Huron’s contributions) and 13% of the Detroit River’s load to Lake Erie, but it has already reduced it’s load by 51% since 2008. • Reaching a 40% load reduction for the Detroit River requires reducing • 23% of all sources (because some reduction has already occurred since 2008) • 51% of watershed sources if Lake Huron is not included • 72% of sources if Lake Huron and the WRRF are not included
Thank you! Web page: www.myumi.ch/detroit-riverContacts:Project lead: Jennifer Read, jenread@umich.eduLead scientist:Don Scavia, scavia@umich.eduStakeholder engagement: Lynn Vaccaro, lvaccaro@umich.edu