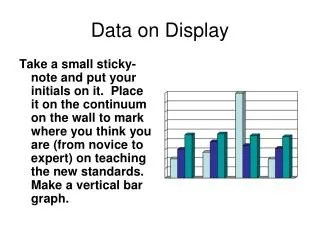
Data Display and Cartography
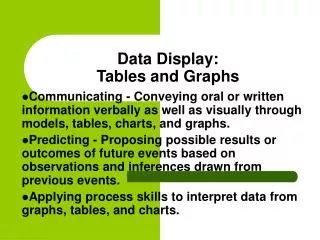
Data Display and Cartography. Chapter 8. Introduction. Window into GIS View, query, analyze maps Map title body legend north arrow scale acknowledgement neatline. Introduction. Communication: part art, part science Easy to use ArcView/ArcMap point and click

Data Display and Cartography
E N D
Presentation Transcript
Data Display and Cartography Chapter 8
Introduction • Window into GIS • View, query, analyze maps • Map • title • body • legend • north arrow • scale • acknowledgement • neatline
Introduction • Communication: part art, part science • Easy to use • ArcView/ArcMap • point and click • no commands to remember • conventional options available • but flexibility
Cartographic Symbolization • Spatial Features and Map Symbols • Characterized by location and attributes • Raster and vector are different • Point, line, area • Other symbols, volumetric or 3-D • Exception, point data for polygon label • Visual variables: size, value, chroma, texture, shape, hue, pattern.
Cartographic Symbolization • Visual variables • Size and texture spacing and quantitative differentiation • Pattern, the type and shape of markings are appropriate for nominal or qualitative data • Other: hue, chroma and value (next topic) • ArcView: marker, pen, fill. • Raster limited to color and some texture/pattern
Use of Color • Art, often misused, esthetics • Hue • quality that distinguishes one color from another, such as red from blue • different hues, different data • Value • lightness or darknesses of color, with darker “more imortant” • Chroma • richness or brilliance of color; higher intensity “more important”
Use of Color • Hue is visual variable better suited for qualitative (nominal) data • Value and chroma are better suited for quantitative data (ordinal, interval, ratio) • No more than 12-15 distinct hues after which use patterns • Color schemes (see ArcView)
Use of Color • Color schemes • single hue scheme (single hue, varied value and chroma) ArcView “red monochromatic” • double-ended or diverging (graduated colors between two dominant) ArcView “blues to reds dichromatic” • part spectral scheme (adjacent colors) ArcView “yellow to orange to red” • full spectral scheme (full spectrum) ArcView schemes for elevation, temperature and percipitation
Type of Map • Classified by function and symbolization • General reference and thematic • General reference (ie USGS quad) • Shows variety of spatial features including boundaries, hydrology, transportation, contour lines, settlements, land covers. • Thematic map • Main objective is to show distribution pattern of a theme.
Type of Map • Quantitative or Qualitative • Quantitative • dot map uses uniform point symbols to show spatial data, each symbol representing a unit value • graduated color uses a quantitative color scheme to show variations in spatial data • choropleth map symbolizes derived data such as average income or population density based on administrative boundaries
Type of Map • Quantitative • dasymetric map uses statistics and additional information to delineate areas of homogeneous values, rather than administrative boundaries. • graduated symbol map uses different sized symbols to represent different magnitudes. Issues of range and discernable differences • chart map uses either pie or bar charts to compare multiple sets of quantitive data. Size can be part of information • flow map displays different quantities of flow data by varying the width of the line symbols
Typography • Type Variations • typeface (design character) • serif and sans serif • weight (bold, regular or light) • width (condensed or extended; roman or italic; upper or lower-case) • points (size) • font (complete set of all variants for a given typeface and size)
Typography • Selection of Type Variations • size: large, bold, caps or thin, lower case, normal • legibility and harmony • conventions: san serif in body, serif in title and legend; italic for water features; upper and lower case for administrative units
Typography • Placement of Text • Point feature • name to upper right • Line feature • in block and parallel to course of line feature • Area feature • name in feature, size dependent on extent • Other • align with boundaries or lines of latitude • names entirely on land or entirely on water
Typography • Labeling algorithms • difficult • scales • conventions • Methods • manual or automatic • predefined relative to symbol • find best placement • leaders, etc • spline along rivers
Map Design • Map design is a visual plan to achieve a goal • Graphic arts, visual perceptions • Layout • arrangment and composition of map elements. • focus, order, balance • templates • ArcView variables
Visual Hierarchy • Developing a visual plan to introduce the 3-D effect or depth. • Figure-ground relationship • Interposition • Sub-divisional organization into primary and secondary symbols
Soft Copy vs Hard Copy Maps • CRT vs paper • Red/Green/Blue (RGB) • screen • emitted • Hue/Saturation/Value (HSV) for custom colors • Cyan/Magenta/Yellow/Black (CYMK) • paper • reflective