Download
1 / 33
330 likes | 476 Vues
Project Outline: Technical Support to EPA and RPOs on the Implementation of the Regional Haze Regulations Estimation of Natural Haze as Part of Total Haze over the US. Smoke Plumes. Smoke Plumes. Regional haze from smoke?. Natural/Manmade?. R. Husar, CAPITA Washington University, St. Louis

E N D
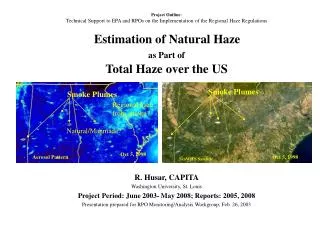
Project Outline:Technical Support to EPA and RPOs on the Implementation of the Regional Haze RegulationsEstimation of Natural Hazeas Part ofTotal Haze over the US Smoke Plumes Smoke Plumes Regional haze from smoke? Natural/Manmade? R. Husar, CAPITA Washington University, St. Louis Project Period: June 2003- May 2008; Reports: 2005, 2008 Presentation prepared for RPO Monitoring/Analysis Workgroup, Feb. 26, 2003 Oct 5, 1998 Aerosol Pattern Oct 5, 1998 SeaWiFS Satellite
Summary of EPA Haze Rule on Natural Conditions • The goal of the EPA visibility program is reaching the natural visibility conditions. • Estimating the overall visibility conditions and the natural conditions establishes how ‘‘close’’ a Class I area is to the goal, i.e. the magnitude of the human-induced ‘exceedance’ over the natural. • The default annual natural visibility is 11-12 deciview for the East, 8 dv for the West. • The regional natural visibility is to be derived from sulfate, nitrate, organic carbon, elemental carbon, and crustal material estimates using IMPROVE methodology. • EPA along with States, tribes, and FLMs to develop and refine the technical guidance on estimating natural conditions (e.g. natural fire and dust) • States, in turn, will work with the FLMs, tribes and EPA in estimating their natural conditions using these guidelines at each Class I area.
The Haze Rules require States to establish and update Baseline, Natural and Current Visibility Conditions • Baseline conditions represent visibility at the time the regional haze program is established, 2000-2004 • Natural conditions represent the visibility conditions that would be experienced in the absence of human-caused impairment. • Current condition is the most recent multiyear average, to be revised for each SIP revision. It includes showing progress from the baseline period.
Regional Haze Rule: Nomenclature and Time Scale Schematics Goal is to attain natural conditions by 2064; Baseline is established during 2000-2004 First SIP & Natural Cond. estimate in 2008; SIP & Natural Cond. Revisions every 10 yrs SOx Emission Trend 1800-2100 Haze Components Natural haze is due to natural windblown dust, biomass smoke and other natural processes Man-made haze is due industrial activities AND man-perturbed smoke and dust emissions A fraction of the man-perturbed smoke and dust is assigned to natural by policy decisions
Natural Aerosol Conditions – Default Values • The Regional Haze Rule provides initial default values for the Natural Haze Conditions • The default haze for the West is 8 deciviews while for the East is 11 deciviews • Obtained by estimating the natural concentration of SO4, EC, OC, NO3, Fine, Coarse Soil • Weighing each aerosol component by corresponding extinction efficiencies. (Trijonis, 1990) WEST Mass Mass Bext Bext EAST
Estimation Procedure for Default Natural Haze • The current natural haze estimation method uses annual average species concentrations and average relative humidity to estimate annual mean natural haze • The day-to-day variability in the annual mean is natural haze is based on statistical assumptions All aspects of the default natural haze estimation can be improved with recently obtained data and analysis techniques:
Regional Haze Guide on Fire Emissions • Forest and other fires can be either natural or man-induced • Many major forest fires can be inherently classified as natural • Other fires are intentional (prescribed) to reduce organic fuel accumulation • Prescribed burning will likely be increasing to reduce catastrophic wildfires • EPA considers some portion of the prescribed fire emissions as ‘natural’. • The Western Regional Air Partnership (WRAP) is conducting interesting policy discussions on defining natural and manmade smoke
RH Guide on Natural Dust • Regional Haze guide document is vague on natural dust • The WRAP RPO has conducted an extensive evaluation of fugitive dust in the West. They concluded that manmade fugitive (mechanically stirred up) dust is not a significant contributor regional haze. By inference, most of the regional dust in the West is non-fugitive windblown dust. • In an early discussion document, Pitchford suggests that a working definition of natural dust could be any dust from non-disturbed soil surfaces, while all the dust from disturbed surfaces would be classified as manmade. • Clearly, there is a need to begin both the scientific/technical as well as the policy discussion about natural/manmade dust.
Project Goal and Objective The goal of the project is to provide technical support to EPA & RPOs on: Estimation of Natural Haze as Part of Total Haze over the US Tasks and Approach: • Conceptual Evaluation of Natural PM and Visibility Conditions • Establish Virtual Workgroup with representatives from EPA, RPOs, scientific community • Quantitative Estimation of Natural Contribution to Total Haze • Conduct Data Analysis for estimating natural contributions (1995+, surf. and satellite obs.) • Real-Time Estimation of Natural Aerosols and Visibility (?) • Routine estimation of natural aerosols/visibility during episodes by a virtual workgroup
Task 1: Conceptual Evaluation of Natural PM and Visibility Conditions • Project Management Approach • Establish a steering group for project guidance (EPA, RPO, Science reps) • Maintain a project website for open virtual workgroup interaction and data sharing • Follow and interact with policy developments at RPOs and EPA • Collaborate with VIEWS, RPO data analysts and RPO modelers Technical Issues • Establish the main natural source types and their properties • Windblown dust (local and distant) • Biomass smoke (forest, grass and other uncontrolled fires, local and distant) • Biogenic emissions (trees, marshes, oceans) • Sea salt, pollen • Evaluate suitable metrics for statistically describing natural conditions • Relevant aerosol components (e.g. SO4, NO3, OC, EC, Dust) • Spatio-temporal scales, resolution and pattern of natural events/conditions
Task 1: Natural Haze Properties • Dust, sea salt and pollen are ‘coarse’ particles. • Dust is composed of irregularly shaped crystals • Sea salt is made of rectangular crystals of NaCl • Pollen are round shaped solid organic particles. • Smoke and marine biogenic particle are ‘fine’ • Smoke particles are droplets of organics from combustion residues • Marine organic particles droplets are from microorganisms on the sea surface Sahara Dust
Task 2: Quantitative Estimation of Regional Natural Contribution Natural Haze (from this Project) • Spatially resolve natural (dust, smoke, other) for each station, focus on Class I areas • Temporally resolve natural haze components for each day • Apply IMPROVE methodology for natural components, including RH Correction • Estimate the natural contribution on best/worst visibility days Current Conditions (from VIEWS) • Spatially resolved haze components for each station, focus on Class I areas • Temporally resolve aerosol components for each day • Apply IMPROVE methodology for total haze calculation , including RH Correction • Identify worst/best visibility days Compare Natural Haze to Total Haze • Implied in this approach is that Current Conditions and the Natural Conditions are analyzed simultaneously • This project to be closely coordinated with other source apportionment work
Current 1996-98 Haze Conditions (IMPROVE) • The current haze level along the West Coast is >15 dv, well over the default 8 dv • Much of the mountainous West is in the 8-10 dv range, very near the default natural value • Most of the Eastern US (except the Upper MW and New Engl.) is above 20 dv, compared to the default of 12 dv natural default. • Expressed as extinction coefficient, the current EUS haze is about 90 Mm-1 compared to the default natural value of about 30 Mm-1 • Hence, as a very rough initial estimate, the EUS extinction levels are currently about 3 times the default natural haze stated in the Regional Haze Regs.
Significant Natural Contributions to Haze by RPO Judged qualitatively based on current surface and satellite data WRAP Local Smoke Local Dust Asian Dust MANE-VU Canada Smoke • Natural forest fires and windblown dust are judged to be the key contributors to regional haze • The dominant natural sources include locally produced and long-range transported smoke and dust • This project will quantify the absolute and relative contribution of natural sources for each RPO CENRAP Local Smoke Mexico/Canada Smoke Local Dust Sahara Dust MRPO Local Smoke Canada Smoke Local Dust VISTAS Local Smoke Sahara Dust
Natural Aerosol/Haze Analysis Tools Analysis Tools • Chemical composition analysis (speciation, traces) • Physical property analysis (satellite, ASOS, PM2.5) • Transport pattern (trajectory) • Combined chemical/transport (trajectory + chemistry) • Dynamic modeling (forward simulation, inversion) Each tool can be applied in the following modes of operation In the actual proposal, these tools will be explained and illustrated
Observational Tools Establishing Source-Receptor Relationship List of Methods by Egen, 1835. See paper and PPT Temporal Pattern Direct Evidence Composition (smell) Spatial Pattern Trajectory Wind Direction
Task 2: Dust Analysis- Local, Sahara and Gobi Dust over N. America • The dust over N. America originates from local sources as well as from the Sahara and Gobi Deserts • Each dust source region has distinct chemical signature in the crustal elements. • The pattern of different dust contributions varies in space as well as by season, episodicity and vertical distribution
Attribution of Fine Dust (<2.5mm) Local and Sahara • In Florida, virtually all the Fine Particle Dust appears to originate from Sahara throughout the year • At other sites over the Southeast, Sahara dominates in July • The Spring and Fall dust is evidently of local origin The two dust peeks at Big Bend have different Al/Si ratios During the year, Al/Si = 0.4 In July, Al/Si reaches 0.55, closer to the Al/Si of the Sahara dust (0.65-0.7) The spring peak is identified as as ‘Local Dust’, while the July peak is dominated by Sahara dust.
Annual July Task 2: Quantitative Estimation of Regional Natural Contributions Approach: • Study each natural aerosol type in detail (dust, smoke, biogenic, sea salt) • Use ALL available aerosol observations (surface and satellite) and model results • Establish source strength/variability and spatio-temporal pattern at relevant scales (e.g.natural aerosol statistics) Example Natural Aerosol Analyses: Sahara Dust The maximum annual Sahara dust contribution is about 1 mg.m3 In July, in the Southeast, Sahara dust contributes 4-8 mg.m3, about 2-4 times the local fine dust. For more detail see: Local and Global Dust Over N. America
Idaho Fires and Sahara DustAug 4, 2000RGB Reflectance Aerosol Optical Depth Retrieval Idaho Smoke Sahara Dust Approaching
Dust Concentration and Transport DVOY Distributed Data Browser About 10 mg/m3 of dust cover the SE Atlantic coast. The back-trajectories show transport from Sahara 10 mg/m3 Back Trajectory, CIRA Fine Dust Concentration, VIEWS Dust Time Series, Cape Romain, SC
Supporting Evidence: Aerosol Pattern and Transport Analysis There are large seasonal differences in the directions that air masses arriving in Big Bend, TX have taken. During winter and into spring, they come from the west and the northwest,while during the summer, they come mainly from the east. • In July (1998) elevated levels of absorbing aerosol (Sahara Dust) reaches the Gulf of Mexico and evidently, enters the continent . • High TOMS dust levels are seen along the US-Mexican borders, reaching New Mexico. Higher levels also cover the Caribbean Islands and S. Florida. • Another patch of absorbing aerosol (local dust?) is seen over the Colorado Plateau, well separated from the Sahara dust.
Aerosol Source Type and Origin AnalysisCombining Chemical Fingerprints and Transport Positive Matrix Factorization PMF, Lye Brook, NH, Wishinski and Poirot (2002) SecondaryCoal Avg. Mass: 3.2 ug/m3 (42%) Species: S, OC, EC, Na Summer Maximum BiomassSmoke Avg. Mass: 2.4 ug/m3 (32%) Species: OC, EC, S, K Summer Maximum East CoastResidual Oil Avg. Mass: 0.38 ug/m3 (5%) Species: OC, EC, S, Si, Ni, V Winter Maximum
Smoke Plumes Smoke Plumes Regional Smoke? Oct 5, 1998 Oct 5, 1998 Task 2: Spatial Analysis of ‘Natural’ Aerosols: Biomass Smoke Nov 15, 1999 PM2.5 conc., smoke pattern and SeaWiFS image of plumes originating from Kentucky, Nov 15, 1999. Satellite data show numerous small fires in the Southeast The type of these fires is not known. Prescribed/agricultural burning? Wild fires? Issue: How does one space-time aggregate such a highly variable emission? More details here here
SeaWiFS Satellite Image, July 4, 2000 July 4, 2000
Smoke Plumes over the Southeast • SeaWiFS-derived aerosol optical depth Smoke ‘flags’ Independence Day, July 4, 2000
Task 3. Real-Time Estimation of Natural Aerosols and Visibility • Rationale • The dominant natural aerosol sources are from windblown dust and biomass smoke. • Both are ‘episodic’, i.e. short-term extreme concentrations that require AQ management actions. • Dust and smoke events can be monitored real-time by numerous surface and satellite sensors. Real-time Aerosol Watch System (RAW) Real-Time Virtual PM Monitoring Dashboard.A web-page for one-stop access to views of current PM/Visibility monitoring data (aerosol, weather) and model output for nowcasting and forecasting. Virtual Workgroup Website.An interactive website which facilitates the active participation of diverse members in the interpretation, discussion, summary and assessment of the aerosol events. Air Quality Managers Console.Delivers a packaged PM data and summary reports prepared by the Virtual workgroups.Helps PM managers make decisions during major aerosol events. The development and implementation of RAW is already being supported at CAPITA by grants from NSF, NOAA, EPA/EMAP, NASA(pending). Incremental funding from this project would support estimating ‘Natural PM/Visibility Contributions’ during such events.
Task 3: Illustration of RAW for Quebec Smoke, July 6, 2002 See http://capita.wustl.edu/aerosolevents Right. SeaWiFS satellite and METAR surface haze shown near-real time in the Voyager distributed data browser Below. SeaWiFS, METAR and TOMS Absorbing Aerosol Index superimposed Satellite data are fetched from NASA GSFC; surface data from NWS/CAPITA servers
Schedule: Phase I: 2003 – 2005 2003 Conceptual evaluation of natural conditions 2003-5 Analyze natural events 2004-5 Regional natural aerosol statistics 2005 – Interim report Phase II: 2005 – 2008 2006 Re-evaluation of natural condition definitions 2006-8 Analyze natural events including model results 2007-8 Revised regional natural aerosol statistics 2008 – Final report
The ASOS Visibility Sensor & Network The ASOS visibility sensor: forward scattering instrument NCDC archives 1 minute ASOS data from 220 stations These NWS ASOS sites are, uniformly distributed over the country
Typical Diurnal Pattern of Bext, Temperature and Dewpoint • Typically, Bext shows a strong nighttime peak due to high relative humidity. • Most of the increase is due to water absorption by hygroscopic aerosols. At RH >90% , the aerosol is mostly water • At RH < 90%, the Bext is mostly influenced by the dry aerosol content; the RH effect can be corrected. Macon, GA, Jul 24, 2000
Seasonal Average Diurnal Bext Pattern • For each minute of the day, the data were averaged over June, July and August, 2000 • Average Bext was calculated for • Raw, as reported • For data with RH < 90% • RH < 90% and RH Corrected • Based on the three values, the role of water can be estimated for each location