Download
1 / 31
330 likes | 352 Vues
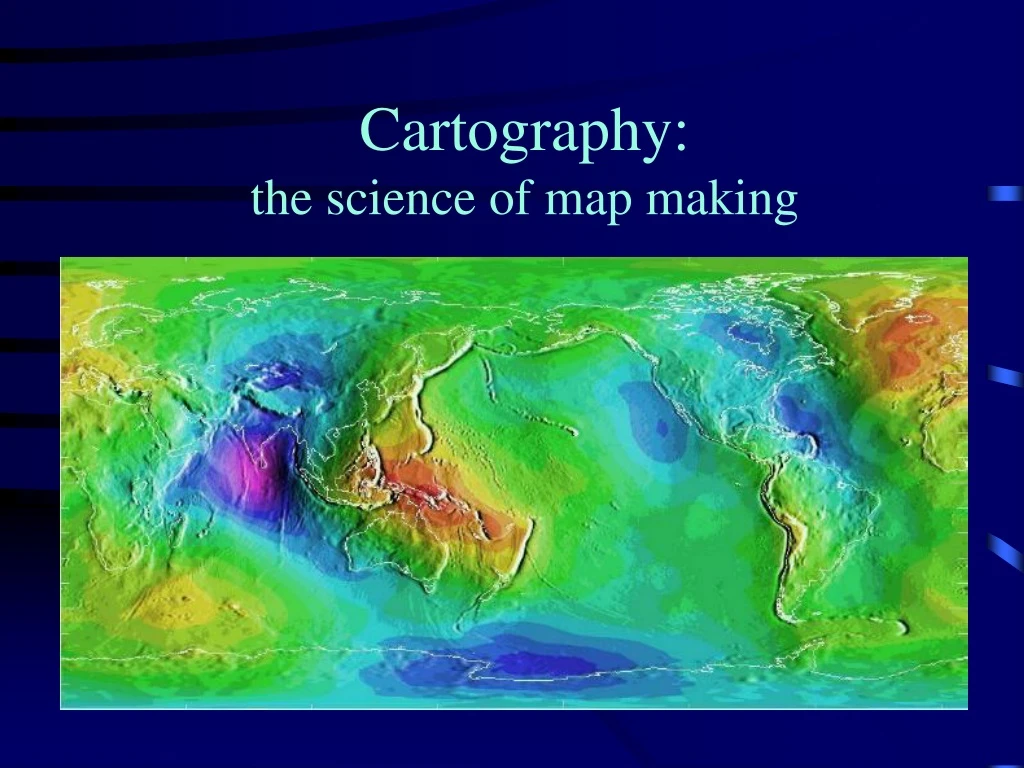
Understand the essential concepts of latitude, longitude, and map projections in cartography. Explore the science of mapping and learn about global coordinate systems, great circles, and time zones. Discover the benefits of maps and how to overcome distortions with map projections.

E N D
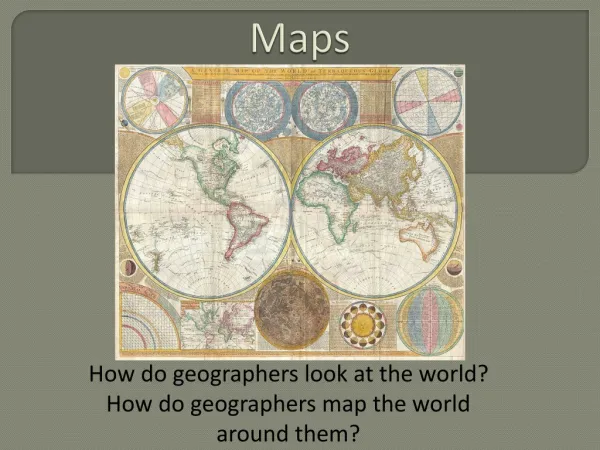
Locating yourself on a Globe • You need a frame of reference • That is the purpose of Latitude and Longitude • Defining these parameters: • Earth rotates on an imaginary axis ~ North and South Poles • Equator: is a great circle that lies equidistant between them.
Great Circles: • ..are imaginary circles of the surface of the earth who's plane passes through the center of the earth. • The circumference of the earth is 25,000 miles of 40,000 km • "Great" because it is the largest possible circle
Great Circles: • 1) cut the earth in half and each half is known as a hemisphere • 2) are the circumference of the earth • 3) provide the shortest routes of travel on the earth's surface. • ** Planes travel in great circles. • ** We were always taught a line is the shortest distance between two points - Not True. • Small circles: circles whose planes do not pass through the center of the earth.
Latitude • Latitude: is the angular distance north or south of the equator. • 1° of latitude = 112 km 360°/40,000 km • 1 degree = 60 minutes • 1 minute = 60 seconds 36°49'52" N • ArcView uses: Decimal Degrees • Sextant measures the angular distance between 2 points (sun & horizon) • **So it easy to determine latitude.
Longitude: • Longitude: no natural reference point • In 1884 by International Agreement Greenwich England was the chosen starting point. • This is called the prime meridian or zero degrees and everything is east or west of that. • (angular distance from Greenwich, England)
The global grid: • Parallels: lines of latitude, only the equator is a great circle all other parallels are small circles (they never meet) • Meridians: these are line of longitude and when joined with its mate half way around the globe form great circles • * the distance between meridians will vary with latitude
Global Coordinate System • Longitude and Latitude • Degrees, minutes, seconds • 1o latitude = 110.5 km (equator) • 1o longitude = 111.3 cos(latitude) • Meridian • Parallel • Great and Small Circles
How the Earth is Divided • Hemispheres: Northern, Southern, Eastern, Western
Time Zones • Solar noon: most towns used this, defined as when a vertical stake cast the shortest shadow. • By the 19th century transportation and communications (namely railroads and telegraph) connected towns and cities, the adopt of a standard time was necessary.
Time Zones (continued) • 1884 at the International Meridian Conference 24 time zones were established. • Greenwich Mean Time (GMT) = Universal time = Zulu time • 360°/24 = 15° for each time zone, however for convenience many time zones follow state and country lines. • International Date Line: where each new day begins 180th meridian • Chronometer
Globes • The Globe is a nearly perfect representation of the earth, it shows the shape and spatial relationships of land and water. • Problem: Can only look at 1/2 at a time. • However globes can not show detail and are big and clumsy.
Benefits of Maps • Maps: are the geographers most important tool. • Benefits: • reproduced easily and inexpensive • different scales • can put an enormous amount of information on a map • roads, buildings, property lines, vegetation, topography • distribution of land forms
Map Features important in GIS • Areas • Lines • width exaggeration • Points • size exaggeration
On a globe four properties are true: • 1) parallels of latitude are always parallel • 2) parallels are evenly spaced • 3) meridians of longitude converge at the poles • 4) meridians and parallels cross everywhere at right angles
Map Projection: • A map projection is a mathematical formula for representing the curved surface of the earth on a flat map.
Distortions • distance • area • shape • direction
You must make a choice between: • Equivalence: equal area relationship throughout the map, however you get distorted shapes. • Conformal: shapes are true and meridians and parallels are at right angles, however land masses are greatly enlarged at high latitudes. • Except for very small areas Conformality and Equivalence are mutually exclusive. • There are over 1000 different projections.
Other types of considerations • Equidistant projections – However scale is not maintained correctly by any projection throughout an entire map • True-direction projections or azimuthal projections, maintain some of the great circle arcs. (The shortest distance between 2 points on a globe is the great circle route.)
Map Projection • Distortions are inherent in maps • Earth is round, map is flat • Projectionis the term used to describe the process of mapping a round surface to flat paper • wide variety of projections possible • each projection causes different distortions to information 13
Cylindrical Projection:example: Mercator • Tangent to the globe at the equator. No distortions at the equator but it increases moving North or South. Nice rectangular grid. • Why are they used in Navigation? *A straight line drawn anywhere on a Mercator projection is a true compass heading: this is called a rhumb line. • However, the distance along this line may vary.
Azimuthal Projection example: Many Polar projections • Plane is tangent to the globe at some point N or S of the equator or one point on the equator. No distortion at the point of tangency but it increases moving away. All directions from the center are accurate. It is like a view from space. Can only see half the world at once. • All great circles passing through the point of tangency appear as straight lines. • Good for knowing the great circle path (I.e. shortest distances, important to navigators.
Conic:example:Lambert Conformal Conic Projection • One or more cones tangent to one or more parallels. Best for mid-latitudes in an E-W direction (U.S.) • A straight line is almost a perfect great circle route (planes use this) • Can be conformal or equivalent
Transformations • The conversion between projections involving mathematical formulas. • Good GIS packages can do this. • Overlaying different projections is not possible.