Download

1 / 13
130 likes | 392 Vues
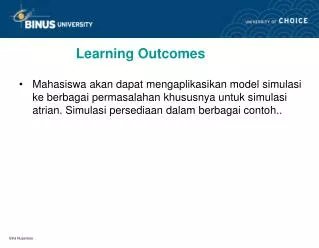
Learning Outcomes. Mahasiswa akan dapat mengaplikasikan model simulasi ke berbagai permasalahan khususnya untuk simulasi atrian. Simulasi persediaan dalam berbagai contoh.. . Outline Materi:. Pengertian Simulasi Atrian Simulasi Persediaan Simulasi Transpostrasi Contoh penggunaan.

E N D
Learning Outcomes • Mahasiswa akan dapat mengaplikasikan model simulasi ke berbagai permasalahan khususnya untuk simulasi atrian. Simulasi persediaan dalam berbagai contoh..
Outline Materi: • Pengertian • Simulasi Atrian • Simulasi Persediaan • Simulasi Transpostrasi • Contoh penggunaan
Building a Simulation Model • General Principles • The system is broken down into suitable components or entities • The entities are modeled separately and are then connected to a model describing the overall system • A bottom-up approach! • The basic principles apply to all types of simulation models • Static or Dynamic • Deterministic or Stochastic • Discrete or continuous • In BPD (Birth and Death Processes) and OM situations computer based Stochastic Discrete Event Simulation (e.g. in Extend) is the natural choice • Focuses on events affecting the state of the system and skips all intervals in between
Steps in a BPD Simulation Project Phase 1 Problem Definition 1. Problem formulation 2. Set objectives and overall project plan Phase 2 Model Building 4. Data Collection 3. Model conceptualization 5. Model Translation Phase 3 Experimentation No 6. Verified Yes No No 7. Validated Yes Phase 4 Implementation 8. Experimental Design 9. Model runs and analysis No Yes 11. Documentation, reporting and implementation 10. More runs
Model Verification and Validation • Verification (efficiency) • Is the model correctly built/programmed? • Is it doing what it is intended to do? • Validation (effectiveness) • Is the right model built? • Does the model adequately describe the reality you want to model? • Does the involved decision makers trust the model? • Two of the most important and most challenging issues in performing a simulation study
Model Verification Methods • Find alternative ways of describing/evaluating the system and compare the results • Simplification enables testing of special cases with predictable outcomes • Removing variability to make the model deterministic • Removing multiple job types, running the model with one job type at a time • Reducing labor pool sizes to one worker • Build the model in stages/modules and incrementally test each module • Uncouple interacting sub-processes and run them separately • Test the model after each new feature that is added • Simple animation is often a good first step to see if things are working as intended
The Real System Conceptual validation • Conceptual Model • Assumptions on system components • Structural assumptions which define the • interactions between system components • 3. Input parameters and data assumptions Calibration and Validation Model verification Operational Model (Computerized representation) Validation - an Iterative Calibration Process
Example 1: Simulation of a M/M/1 Queue • Assume a small branch office of a local bank with only one teller. • Empirical data gathering indicates that inter-arrival and service times are exponentially distributed. • The average arrival rate = = 5 customers per hour • The average service rate = = 6 customers per hour • Using our knowledge of queuing theory we obtain • = the server utilization = 5/6 0.83 • Lq = the average number of people waiting in line • Wq = the average time spent waiting in line Lq = 0.832/(1-0.83) 4.2 Wq = Lq/ 4.2/5 0.83 • How do we go about simulating this system? • How do the simulation results match the analytical ones?
Example 2: Antrian saluran Tunggal Misalkan data empiris tentang distribusi kurun waktu antara pertibaan dan distribusi waktu pelayanan sbb: Variabel acak yang harus disimulasi secara langsung ialah : a. Kurun waktu antara pertibaan (T) b. Kurun waktu pelayanan (L), lalu c) Buatlah SIMULASI untuk menggambarkan satu periode waktu yg mencakup 10 pertibaan ?
Struktur Simulasi untuk T Perlu dicatat bahwa titik tengah selang ditetapkan sebagai variabel acak.. Kemudian untuk struktur simulasi L dapat dilihat berikut ini :
Struktur Simulasi untuk L Maka satu simulasi untuk satu periode waktu yang mencakup 10 pertibaan adalah seperti berikut ini :
Terima kasih Semoga Berhasil