Download
1 / 25
300 likes | 704 Vues
Periodic function. Basics of Fourier transform. FOURIER TRANSFORM of a non-periodic function. f(t) must be limited: physical signals carry limited amounts of energy. Hp. f(t) must have a finite number of discontinuities. Fourier transform. Inverse Fourier transform.

E N D
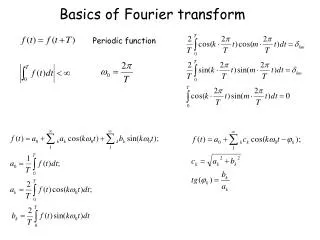
Periodic function Basics of Fourier transform
FOURIER TRANSFORM of a non-periodic function f(t) must be limited: physical signals carrylimited amounts of energy Hp. f(t) must have a finite number of discontinuities Fourier transform InverseFourier transform By definition of Dirac’s delta The ‘vectors’ are good orthonormal base for every finite energy signal f(t) can be split in its even E(t) and odd O(t) components:
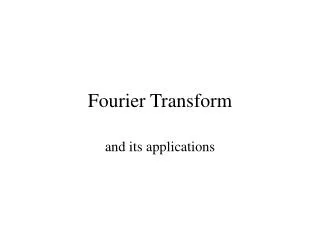
Periodic vs non- periodic functions: Fourier spectrum Time domain Frequency domain |F| Periodic Not periodic |F| ω
Convolution and Fourier transform Time domain Frequency domain The integral in time domain turns intosimpler algebraic product in the Fourier frequency domain. It is much easier to describe the transfer function of sequential ‘blocks’ in term of frequency response: only at the last step the time behavior time domain is inferred ω→t Time domain Frequency domain
Logarithmic attenuation and gain ratios Attenuation and gains relative to voltage (V), current (I), power (P), but also pressureand other physical quantities are usually measured as adimensional ratios towards areference value of the measured quantity, let us say a voltage V0, current I0, power P0 20 dB every decade of gain By definition: -20 dB every decade of attenuation So, if this means a 3dB gain, if the attenuation is -20dB in the signal Otherwise, a -6dB attenuation means If we deal with power
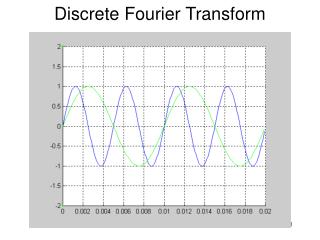
Vout Vin R C -3 dB 20 dB ω→¥ 1 decade Bode’s diagrams If we want to study the behavior of a ‘block’ in the frequency domain responding to sinusoidal stimulus we define: Example: RC network Time constant (TC) ω→0 0.707 BW ωt: roll-off freq ω ωt ωt
LOCK IN COMPONENTS: SIGNAL MIXER IDEAL Frequency/istantaneous signal mixer Signal ‘Reference’ • Some simplifications without loss of generality: • S(t) and R(t) can be choosen periodic, even with different pulsations ωs and ωr • we can choose <S(t)>=0,<R(t)>=0 (Fourier expansion coefficients a0=0) ak=0 k>0, b1=R ak=0 k>0, b1=S bk=0 n>1 bk=0 n>1
LOCK IN COMPONENTS: SIGNAL MIXER Frequency Content Mixer output In our particular case Hp. DC component AC component If ωs≠ ωr the DC component vanishes, no matter about phase lags between the two signals
LP |A(ω)| 1 ωt ω LOCK IN COMPONENTS: LOW-PASS FILTER The IDEAL low-pass filter (infinite roll-off) |F| Provided that φ could be regulated we have singled out the weight of the component in the signal S(t) at the reference frequency ωr ω 0 ωr-ωs ωr ωs ωr+ωs ONLY DC component pass |F| |F| ω 2ω 0 0 2ω ωt: rolloff frequency
LOCK IN COMPONENTS: Low-pass filter properties LOCK IN COMPONENTS: After the LP filter only the RMS amplitude of the signal will be extracted, acting like a demodulator Rectifier C R TC=RC The LP filter behaves as an integrator for spectral components in the signal with pulsations larger than ωt: this is equivalent to an integration performed up to nTC (up to infinite if roll-off or ‘order’ n of the filter is infinite). The istantaneous mixer output is so integrated to yield by definition self-correlation between the reference and the input signal Signal switched on at t=0
LP |A(ω)| 1 A zero frequency (very narrow) band-pass filter is obtained with: or S/N ratio (typ. ωr ≈ 1kHz, Δω ≈ 0.01Hz) A zero frequency (very narrow) band-pass filter is obtained with: or S/N ratio (typ. ωr ≈ 1kHz, Δω ≈ 0.01Hz) RMS value of the stimulus is known, then φ has to be tuned to find the max rms value of the signal , in this respect this block is phase-sensitive ωt ω LOCK IN COMPONENTS: The phase-sensitive detector (PSD) Given a reference R(t) with proper pulsation ωr, whatever the form of the input signalS(t), the DC output component of this block will depend only on the weight of thespectral component of the signal at ωr, apart relative phase lag φ.
LP |A(ω)| 1 ωt ω Lock-in building blocks: The phase shifter and PLL A phase shifting network (Φ) has to be applied to the reference (most common) to maximize output Mx Φ reference Mixer 1 sin M φ cos Reference inphase quadrature Mixer 2 Phase of the output signal can be fed back to drive the phase shifter:auto-phase-locking through a Phase Locked Loop (PLL) block
From ideal to a real lockin amplifier REAL mixer carries ωs± ωr AND ωs, ωr AND image frequencies ωs± 2ωr, ωr± 2ωs IDEAL mixer carries only ωs± ωrfrequency content But this is the least problem, due to the following LP filter, cutting off/integratinghigh frequency band of the mixer ouput. IDEAL LP filter has a cutoff frequency ωt =0 and infiniteroll-off REAL LP cannot have ωt =0, but onlyωt→0, AND roll-off must be finite LP filter output can NOT be noise immune if ouput spectral BW is zero (ωt =0 and infinite roll-off) also output power is zero!ωt =0 means infinite integration time or TC: definitely we won’t wait the eternity to read the output A REAL measuring device will be affected by noise from several sources and in any circuit block: in our case the worst one is the noise at the amplifier input stage
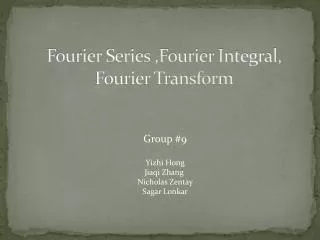
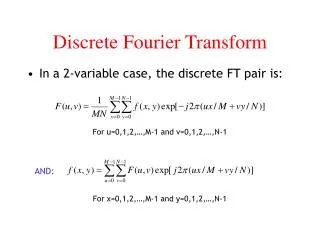
Noise amplitude vs frequency 1/f noise Johnson noise White noise Shot noise log(Vnoise) 0 log(f ) 0.1 1 10 100 1kHz Noise sources Intrinsic : mainly noise of the input terminals of the amplifier stages • 1/f:ensemble of excitation-deexcitation processes in semi-conductors into environmentalthermal bath, almost independent from amplifier input bandwith BW • White noise • Johnson noise • Shot noise Thermal fluctuationsof electron density inany resistor R Thermal/quantumfluctuations of discretenumber of chargecarriers: e=1.6·10-19C Extrinsic: MUCH more complex • RF/EMI interferences • Mains supply lines radiating at 50/100 Hz • Capacitive/Inductive coupling with surrounding devices • Ground loops Spectral density hasto be recognized forevery particular set-upof experiment Are only most common source of external noise
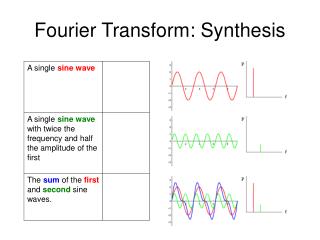
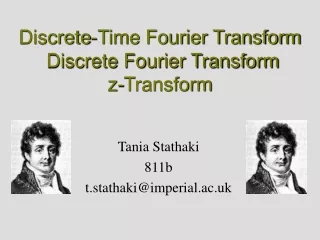
2 log(Vnoise) 2 log(Vnoise) Input BW 0 0 log(f ) log(f ) 0.1 1 10 100 1kHz 0.1 1 10 100 1kHz Lock-in I/O Signal and noise power spectral densities • Typical power spectral density at the input in a ideally good case (no ext noise): colored areas proportional to the power of noise and signal SignalBURIEDin noise Noise power Signal power(at ωr) LesserLP filter BWHigher TC HigherS/N ratio Signal • After PSD detector/integrator BUT Shifted to DC If TC is too large (ωt→0)not only noise, but also signal power will be lost ! Noise LP filterbandwidth ωt Input BW S/N ratios at low frequencies will be poorer in any case: choose reference/stimulus in the 100 Hz-10 kHz freq. range
|A(ω)| Gdc 1 ωt ω ωr The ‘classic’ lock-in setup System Noise A B B DC Output Mixer C D + Signal Gac Band-pass FilterAC amplifier LP / integrator Φ ωr PLLtracks φ,ωr Phase shifter Ref. generator • The reference can be generated: • internally: a built-in oscillator excites the system directly or through transducers • externally: further device excites the system and a PLL circuit has to drive the built-in oscillator to desired stimulus frequency and compensate phase lags Question: how will an unknown system respond to an external harmonic stimulus?
Spectral transfer functions of lock-in blocks 60 Hz supply noise B A C D
ωr Response of a physical system to a periodic stimulus I A will be modulated with respectto the harmonic stimulus at ωr A(λ) λ System BUT The response function A(λ) could not be trivially linear (a), and typically is NOT linear (b),or even resonant (c) (c) Anharmonic terms Linear/harmonicterm non-linear distortion higher order harmonics
Response of a physical system to a periodic stimulus II The modulated λ itself could be periodic but not harmonic, like square wave atpulsation ωr: typical of laser beam intercepted by a mechanical chopper wheel Taylor series problem: this full series expansion is almost unmanageable ! Fourier series • Δλ<<λ0 • λ1 (and λ2) >> λk for k>1(2) • λ1>λ2 • |A(k)|<<|A(1)| Small λ modulation Only lower order terms of Taylorseries will contribute Hp: First harmonic ωr (and first overtone 2ωr) dominant
Discussion of Remember that The k-th order spectral weight will be: Ex.: Which of these terms will give an output after the PSD/integrator?
Lock-in output vs. mixer harmonics Most generally N: integer sum of harmonics ΔφN: sum of phases At the output of PSD/demodulator we have: Only surviving terms are for N=0 When the base (k=1) harmonic is fed into the reference input mixer weobtain an estimate of the spectral weight S1 at the lock-in output
Spectral weights Sk vs signal derivatives k=1 The dominant contribution comes from:initial hypotheses discard higher ordercontributions The output is proportional to the first derivative of the input signal,again provided that modulation of the parameter Δλ<<λ0 Experiment is modulated at ωr but reference input of the mixer is drivenat 2ωr by means of a frequency doubler/multiplier:2f detection k=2 Which one will prevail? 2 terms: In most general case the answer is not unique! Not necessarily S2 is univocally proportional to second derivative only
Peculiar cases of λ coupling Linear coupling of λ and A:good approx. For Δλ→0 Only first derivative will be detected Linear coupling of λ and excitation U Sk term is proportional mainlyto the k-th derivative Notice that 2f detection of 2ndderivative requires a -π/2 phase shift with respect to usual1f detection
Non-linear resonant coupling with λ G: full width half maximum (FWHM) Only 2ω component For Δλ<Γ Γ lres The RMS value of the modulation of A(λ), versus amplitude (AM) or frequency (FM) modulation of λ, yields a term proportional to the first derivative of A(λ), if Δλ<Γ
Example: STS point spectroscopy The tip is held at fixeddistance from the sampleTip or sample bias is scannedwith a linear ramp and I(V) isacquired Tip The bias is modulatedwith a small amplitudevoltage (some mV) sample ‘Lock-in’ derivative Numerical derivative MUCH betterS/N ratio!