Fourier Transform
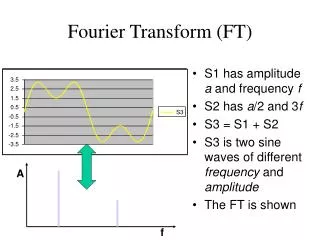
Since this object can be made up of 3 fundamental frequencies an ideal Fourier Transform would look something like this:. A Fourier Transform is an integral transform that re-expresses a function in terms of different sine waves of varying amplitudes, wavelengths, and phases. Fourier Transform.

Fourier Transform
E N D
Presentation Transcript
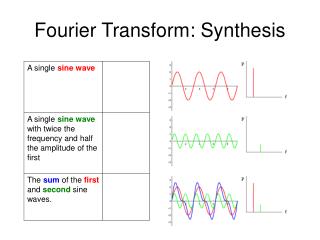
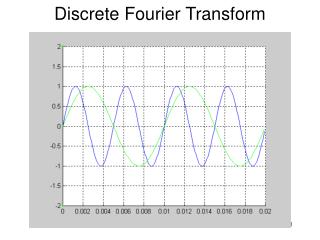
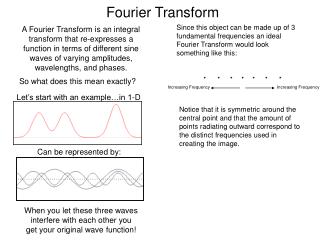
Since this object can be made up of 3 fundamental frequencies an ideal Fourier Transform would look something like this: A Fourier Transform is an integral transform that re-expresses a function in terms of different sine waves of varying amplitudes, wavelengths, and phases. Fourier Transform So what does this mean exactly? Increasing Frequency Increasing Frequency Let’s start with an example…in 1-D Notice that it is symmetric around the central point and that the amount of points radiating outward correspond to the distinct frequencies used in creating the image. Can be represented by: When you let these three waves interfere with each other you get your original wave function!
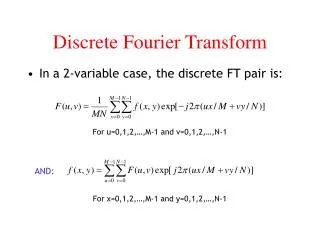
Let’s Try it with Two-Dimensions! This image exclusively has 32 cycles in the vertical direction. So what is going on here? The u axis runs from left to right and it represents the horizontal component of the frequency. The v axis runs up and down and it corresponds to vertical components of the frequency. x-y coordinate system Fourier Transform This image exclusively has 8 cycles in the horizontal direction. u-v coordinate system The central dot is an average of all the sine waves so it is usually the brightest dot and used as a point of reference for the rest of the points. Since this is inverse space, dots close to the origin will be further apart in real space than dots that are far apart on the Fourier Transform. (Again keeping in mind that these dots refer to the frequency of a component wave.) You will notice that the second example is a little more smeared out. This is because the lines are more blurred so more sine waves are required to build it. The transform is weighted so brighter spots indicate sine waves more frequently used. Fourier Transform Images are from: http://www.cs.unm.edu/~brayer/vision/fourier.html
Let’s Bring it Up a Few Notches This image exclusively has 4 cycles horizontally and 16 cycles vertically An original image without imaginary numbers will always be symmetric across the y-axis, regardless of what the actual image is. If the image is symmetrical across the x-axis in real space then it will also be in inverse space. Each of the horizontal points is fractured by the vertical parts and vice versa. This only happens because the original image was blurry. This image exclusively has 32 cycles horizontally and 2 cycles vertically Fourier Transform Images are from: http://www.cs.unm.edu/~brayer/vision/fourier.html
Magnitude vs. Phase What do Magnitude and Phase physically appear as on the FT? The Fourier Transform is defined as: Where F(w) is original function and f(t) is the transformed function Since Computers don’t like infinite integrals a Fast Fourier Transform makes it simpler: These two images are shifted pi with respect to each other. Where F(x,y) is real and f(u,v) is complex. So what do we do with this? Well instead of representing the complex numbers as real and imaginary parts we can represent it as Magnitude and Phase where they are defined as: They look the same! This is because when we look at FT images they are actually just the magnitude and all information regarding phase is disregarded. Magnitude is telling how much of a certain frequency component is in the image. Phase is telling where that certain frequency lies in the image. This is because FT Phase images are much to difficult to interpret. Fourier Transform Images are from: http://www.cs.unm.edu/~brayer/vision/fourier.html
Rotation Effects This is only caused by the abrupt ending of the box so it can be resolved by making it less abrupt. These two images are identical except the right one has been rotated 45 degrees. This is better but it isn’t perfect because of the blurring around the edges. What happened? The FT always treats an image as a periodic array of horizontal and vertical sine curves. Since the images abruptly ends at the edges of the box it has a strong effect on the image. This is the True FT image of the pattern rotated 45 degrees. Fourier Transform Images are from: http://www.cs.unm.edu/~brayer/vision/fourier.html
Let’s Look at Some Real Images! In this image you have a bunch of cells that are all the same size but there is no order to their arrangement. There are enough of them that they are pretty tightly packed in some regions. This image for example looks ordered but I couldn’t tell you exactly what that order is. After taking a FT of the image it is very apparent what sort of order it has and one can determine all the distances between nearest neighbors just by taking the reciprocal of the distances between a dot and the center of the image. This is reflected in the FT image because there is a circle which represents the average distance they are from each other but it also shows that there is no preferred long range order. The power of FT is that it allows you to take a seemingly complicated image which has an apparent order that is difficult to determine see and break it up into its component sine waves. Fourier Transform Images are from: http://www.cs.unm.edu/~brayer/vision/fourier.html
Tying Up Some Loose Ends Let’s say we have a duck that we FT Now we run a Low Pass Filter: This makes it more difficult to distinguish between different regions. Now we run a High Pass Filter: A Practical Application: There is a considerable loss in detail which suggest the duck is larger than it is. In STM this makes the atoms appear larger than they are and the ripples look a lot like electron ripples on surfaces. This can be used to eliminate noise without doing an all purpose High Pass Filter that can eliminate detail of the objects being studied! Fourier Transform Images are from: http://www.ysbl.york.ac.uk/~cowtan/fourier/fourier.html
Magic Tricks If an image is made that combines the magnitudes of the duck with the phases of the cat you get interesting results: The phases contribute most of the structural information for this plot. Unfortunately FT images we deal with only give magnitude information so much of this information is lost. Fourier Transform Images are from: http://www.ysbl.york.ac.uk/~cowtan/fourier/fourier.html
Credits: 1) http://www.cs.unm.edu/~brayer/vision/fourier.html 2) http://www.ysbl.york.ac.uk/~cowtan/fourier/fourier.html