Download
1 / 21
210 likes | 460 Vues
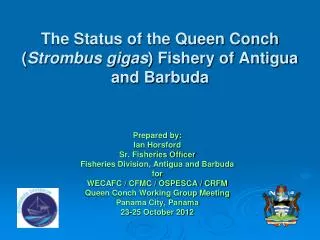
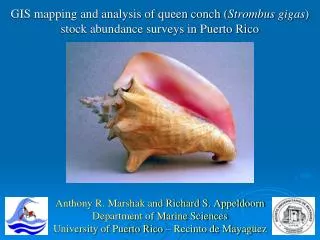
GIS mapping and analysis of queen conch ( Strombus gigas ) stock abundance surveys in Puerto Rico. Anthony R. Marshak and Richard S. Appeldoorn Department of Marine Sciences University of Puerto Rico – Recinto de Mayag ü ez. Queen Conch ( Strombus gigas ).

E N D
GIS mapping and analysis of queen conch (Strombusgigas) stock abundance surveys in Puerto Rico Anthony R. Marshak and Richard S. Appeldoorn Department of Marine Sciences University of Puerto Rico – Recinto de Mayagüez
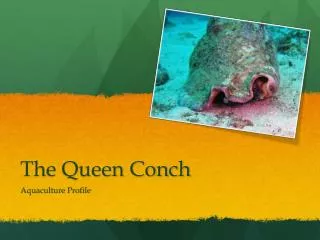
Queen Conch (Strombusgigas) • One of the most important commercial species within the Caribbean, • especially in Puerto Rico. • Greatly overfished within most Caribbean waters, with severe population • declines throughout the region
Queen conch in Puerto Rico • Most PR queen conch landings concentrated in the E and W coasts, primarily SW insular platform. • Conch depletion within shallow seagrass beds, and fishing effort has moved into deeper habitats.
Queen conch stock surveys • Fisheries independent stock abundance surveys: • Estimate average densities within a variety of habitats over a large area using strip transects and underwater scooters • May collect in-situ size and stage information over time. • Many management applications for monitoring the population, or its response to any mgmt action
GIS Conch Plotting • Determine exact conch locations with GPS recorded transect start and endpoints • Divers record start and end time; time of encounter of conch and habitat/depth • Habitat, depth, conch size, stage incorporated into GIS accessory data. • Spatial Analyst Density calculator gives overall distribution and aggregation patterns.
Survey Results of the Puerto Rico West Insular PlatformThree Surveys over a ten-year period(1995-96, 2001-02, 2006)
Habitat Density Results by Age Class Sum all area surveyed per habitat and number of conch encountered to get densities
Conclusions • Highest densities of juveniles and adults in all surveys within shallow seagrass • Other juv’s and adults clustered in smaller numbers in deeper algal sand habitats • Densities of 2006 survey higher than in previous surveys • Recurring large-scale conch concentrations exist along the western shelf. • These may be classified by habitats and depths • More pronounced conc’s in the SW shelf due to expansive seagrass habitat • Current patterns, habitat type, and the attraction of conspecifics are likely playing a role in the recruitment of individuals to these areas. • Juveniles are settling/recruiting into both shallow seagrass and deeper algal sand habitats, but higher proportions and densities are found within seagrasses. • Adults and older conch are somewhat more restricted in location along the shelf and lower in number.
Conclusions • GIS mapping of surveys permits high understanding of large scale habitat connectivity in queen conch. • Distinct regions and their concentrations may be identified to aid in future management, and to complement stock abundance montioring • It would appear that the seasonal closures were effective in allowing for population increase, but still a long way to go. • Alee Effect at <48 conch/ha, where reproduction ceases • Future Applications: • Essential Fish Habitat • Population Dynamics • Comparison to fishermen data • Ecosystem based management • Biological and Management applications • Seasonal survey periodicity and stratification • Future studies