Download
1 / 26
260 likes | 401 Vues
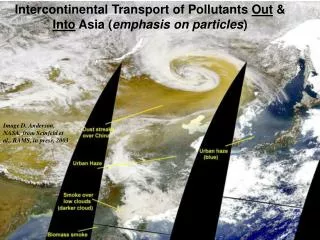
Intercontinental Transport of Pollutants Out & Into Asia ( emphasis on particles ). Image D. Anderson, NASA, from Seinfeld et al., BAMS, in press, 2003. Intercontinental Transport of Pollutants Out & Into Asia. What do we know about the transport mechanisms? How good are the models?

E N D
Intercontinental Transport of Pollutants Out & Into Asia (emphasis on particles) Image D. Anderson, NASA, from Seinfeld et al., BAMS, in press, 2003
Intercontinental Transport of Pollutants Out & Into Asia • What do we know about the transport mechanisms? • How good are the models? • What are the sources of uncertainty? • What do the observations tell us? • What are some next steps?
NASA-Seawifs The CFORS forecast (upper left) of the two dust systems are shown above. The dust plume (pink) represents the region with dust concentrations greater than 200 mgrams/m3. White indicates clouds. The SeaWifs satellite image (upper right) also clearly shows the accumulation of dust spiraling into the Low Pressure center. Also note the strong outflow of dust in the warm sector “ahead” of the front over the Japan Sea. The two systems are clearly seen in the satellite derived TOMS-AI (aerosol index) (lower right). The dust event is clearly seen in the China SEPA air pollution monitoring network. Lower left hand panel shows extremely large ground level concentrations (http://www.ess.uci.edu/~oliver/tracep/airqual/index.html). The sandstorm and sand-drifting weather, which swept across most parts of China caused severe visibility and air quality problems http://news.xinhuanet.com/english/20010409/395181.htm
Transport Mechanisms: As informed by field experiments & models (e.g., Trace-P, Ace Asia, ITCT-2k2/Peace, ICARTT, ABC) • Convection • Warm conveyor belt lifting • Post-frontal boundary layer transport • Low level pre-frontal • Advection in the westerlies • Cold front subsidence • Large-scale subsidence • Mountain wave subsidence • Boundary layer transport Liang et al., JGR, 2004
Example: Results from Peace/ITCT2K2 Convection 8% of time accounts for ~35% of outflow flux Oshima et al.,JGR, 2004
One Model’s View: One Spring Dust Sulfate BC
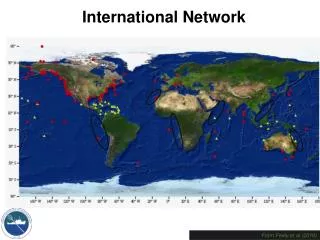
Transport to Asia 100°E Wild, et al., 2004 viz. Newell and Evans [2000]
How Good Are the Models? • Model inter-comparison studies focused on Asia: e.g., MICS-Asia, DMIP, Trace-P/Ace-Asia • Comparisons of predictions with observations
MICS Phase II Results: Concentrations agree better than deposition fluxes Model-1 Model-2 Model-3 Model-4 Model-5 Model-6 Model-7 Model-8 Sulfate concentration in March 2001 (mg m-3) http://www.adorc.gr.jp/adorc/mics.html contents
DMIPS: Dust inter-comparison study Spread in mean vertical profiles Uno et al., 2005
Model Intercomparison Study (MICS) Asia: Source/Receptor Predictions http://www.adorc.gr.jp/adorc/mics.html
What are the Major Sources of Uncertainty in the Calculation of Aerosol Export? Emissions Streets et al., JGR, 2003
Removal Processes Remain Poorly Characterized in Models Impact of Wet Removal on Predicted BC Progress limited by lack of understanding and observations
Summary of Major Sources of Uncertainty in the Calculations Summary of estimated relative uncertainties* for integrated aerosol quantities (column amounts, fluxes) *(uncertainty divided by mean value). Note: for analysis of specific points some of these terms are larger…
How do the models perform with respect to observations? Sulfate Obs M BC
Comparison of Predictions vs Obs for INDOEX and Ace-Asia (Ron Brown ship data) Sub-micron Super-micron Total Mass Composition
Comparison of Observed and Predicted Chemical composition (sub-micron mode)
Export of Particles: One Model’s View -- One Spring Models predict a larger fraction of BC & OC (wrt sulfate) is transported out of Asia
What do the observations tell us? Model-based Observation-based 40% ~40% exported Both approaches have large uncertainties !! Koike et al., JGR, 2003
Ace Asia Aerosol Column Means: Summary of Uncertainty, Model to Model Variability, and Predictability(NOAA CCSP, ABC) 2 Models: MOZART STEM
Final thoughts • Analysis is highly uncertain due to understanding, current state of models, inputs and available observations. • Presently observations are used to compare with predictions --- good for process development, confidence building. • Observations by themselves can not provide the answer -- models necessary …. but also can’t do it alone. • Improved understanding needed to reduce uncertainty: • Processes (deposition) • Role of clouds (transport & removal) • Emissions
Final thoughts (cont) • Enhanced measurements (systems and experimental designs) needed to constrain the problem Expanded Monitoring Activities Will Provide Valuable new Information EANET ABC
Integration of measurements and models needed…ensemble and data assimilation (get uncertainies, inversion for emissions and removal parameters, etc.) Final thoughts (cont) Amir et al., JGR 2005 McKeen et al., in prep.