Download
1 / 46
460 likes | 567 Vues
Scaling Regional Land-Atmosphere Fluxes of Carbon Dioxide with Mesoscale Observation Networks. Impact of land cover variability, management & disturbance. Ankur Desai The Pennsylvania State University Department of Meteorology 19 September 2005 Pre-dissertation defense.

E N D
ScalingRegional Land-Atmosphere Fluxes of Carbon Dioxide with Mesoscale Observation Networks Impact of land cover variability, management & disturbance Ankur Desai The Pennsylvania State University Department of Meteorology 19 September 2005 Pre-dissertation defense
What is a pre-defense? • “Six to twelve months prior to the Final Oral Exam, students must give an informal public pre-defense seminar” – Meteorology Graduate Student Handbook • “Both the thesis adviser and the student are responsible for ensuring the completion of a draft of the thesis and for adequate consultation with members of the thesis committee well in advance of the oral examination” – Graduate Program Degree Bulletin • Two views: • For public to raise any concerns prior to final oral exam • For committee to get up to speed prior to defense • A third view:
What is a pre-defense? • For the student • A retrospective and a chance to show that you’ve done the hard work and it’s not as bad as it looks Source: phdcomics.com
Outline • A. What’s the point? • B. What did you do and how does it come together? • C. What’s the relationship of B to A?
Motivation • 1. Understanding regional carbon dynamics is key for linking global change to the landscape and vice versa Source: ICDC7 Courtesy of S. Denning
Motivation • 1. Understanding regional carbon dynamics is key for linking global change to the landscape and vice versa Source: Nemani et al (2003)
Motivation • 1. Understanding regional carbon dynamics is key for linking global change to the landscape and vice versa Upscale via ecosystem models and networks of towers. Move towards regional inverse modeling
atmosphere foresters farmers citizens industrialists ocean forests farms cities industry economics institutions policy Motivation • 2. The effects of disturbance and land management on surface-atmosphere exchange are poorly understood Courtesy of S. Denning Source: Ryan et al (2005)
(NRCS/USDA, 1997) Motivation • 2. The effects of disturbance and land management on surface-atmosphere exchange is poorly understood Courtesy of S. Denning Source: Hurtt et al (2002)
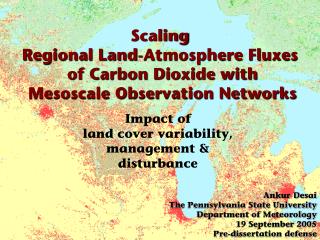
Motivation • 3. The upper-Midwest USA is a complex, managed, heavily forested & densely-instrumented landscape that is ideal for testing the roles of disturbance, management and scaling on the regional carbon cycle MODIS IGBP 1km landcover Cartography by A. Desai
Questions & Hypotheses • What is the role of disturbance and land management on surface-atmosphere exchange on carbon dioxide? • To what extent can regional carbon balance be scaled using only dominant ecosystem types and coarse-resolution ecosystem models parameterized with global biome-scale parameters? • Do multiple top-down and bottom-up scaling methods with a high density observation network converge to the regional carbon flux?
Approach Theory Observations Models
Theory • Eddy covariance • Turbulent stand-scale measurements of vertical velocity and CO2, when properly screened for nocturnal drainage and representative surface-layer footprints, can be used to derive stand-scale carbon exchange parameters • Stand age since disturbance and carbon balance • Ecological theories on carbon dynamics with plant succession can be confirmed with observations and parameterized in models • Top-down and bottom-up scaling • Regional carbon balance can be assessed with linear scaling of observed fluxes using land cover inventories • Atmospheric mass-balance approaches can be used with sufficient inflow and outflow data coverage
Observations • Eddy covariance flux towers • 12+ fixed and roving towers in variety of age/types • 396m tall tower • Carbon dioxide mixing ratios • in-situ high-precision measurements at 6 spots • aircraft tropospheric profiles, solar-spectra column CO2 • Meteorological measurements • Tower micrometeorology • NCEP North American Reanalysis (32 km) transport • Atmospheric sounding-based boundary layer properties • Land cover remote sensing • IKONOS (1m), LandSat (30m), MODIS (1 km), others • Stand/plant/soil characteristics • Biometric / inventory data / harvest rate / land use change • plant/soil physiology from chamber fluxes
Models • Synthesis aggregation mesoscale flux scaling • model infers photosynthesis and respiration parameters from eddy covariance flux towers • parameters, driven with tall tower meteorology, are applied to land cover and stand age maps • Ecosystem Demography model • explicit consideration of disturbance, land-use change, mortality, light competition and forestry • parameterized with inventory data and chamber flux physiology • Mass-balance flux inference • parameterized with tower CO2, aircraft and column CO2, reanalysis transport and sounding or TKE derived ABL depth • zero-order jump model • Eulerian model for daytime, LaGrangian parcel trajectory for 24-hr
I Am Not Weiguo • Weiguo Wang’s dissertation: • Focused on single tall tower • Decomposed stand fluxes from it • Computed regional flux from tall tower only • Considered role of stand type and wetlands • Developed sophisticated footprint models • My dissertation: • Builds on Weiguo’s approaches • Assimilates dense mesoscale data network: • Multiple towers • Mixing ratio network • Chamber and biometric data • Explicitly considers role of stand age, disturbance and management • Observations • Models
Dissertation Outline • Chapter 1. Introduction • See last 15 slides • Chapter 2. Observed evidence on impact of stand age on carbon exchange • Published in Desai et al. (2005) • Chapter 3. Variability of mesoscale carbon exchange and synthesis aggregation scaling • Published in Desai et al. (2006) - accepted • Chapter 4. Ecosystem modeling with explicit consideration of disturbance • in collaboration with P. Moorcroft, Harvard U. • Chapter 5. Mass balance regional flux from high density mixing ratio observations • Chapter 6. Conclusion
Impact of Stand Age • By comparing two sites, one of which serves as a presettlement analogue of the other, we can test the theories of carbon exchange and stand age Courtesy of B. Cook & D. Mladenoff
Impact of Stand Age • Compared two sites with similar climate • Results presented at oral comps talk and published in Desai et al. (2005) • Unmanaged site had significantly smaller carbon exchange than 70-yr old clearcut hardwood site • Due primarily to increased ecosystem respiration but also significant effect of reduced gross ecosystem production • Old site is still a small carbon sink (except in 2004) Source: Desai et al. (2005)
Impact of Stand Age • Unmanaged site had greater temperature – respiration sensitivity • Results contradicted by chamber flux measurements • Unmanaged site had similar low radiation – photosynthesis sensitivity to mature site, but lower maximum capacity • Confirms standard theories of net carbon production and stand age Source: Desai et al (2005)
Impact of Stand Age • Both sites had significant nonhomogenous respiration responses with wind direction • Venting anomaly diagnosed for mature hardwood site • Influence of landcover found at unmanaged site, and small effect of nocturnal slope drainage (horizontal advection) • Horst and Weill surface layer footprint model used to diagnose impact of landcover combined with method of Martano (2000) to use sonic anemometer data to get surface roughness and displacement as functions of wind direction
Observed Variability and Scaling • 12+ eddy covariance flux towers in region assessed for variability • No significant difference in meteorology among sites • Stand age/cover lead to significant differences in carbon flux • Coherent interannual variability in NEE and GEP
Observed Variability and Scaling • Dominant canopy height and stand age since disturbance can explain variations in net carbon exchange and gross production • Ecosystem respiration has U-shaped function – highest in young and old stands
Observed Variability and Scaling • Remotely sensed land cover used to assess variability of cover type with space • Resolution has large impact
Observed Variability and Scaling • Stand age variability observed with forest inventory data from U.S. Forest Service • Age and cover data combined
Observed Variability and Scaling • Net carbon fluxes computed by aggregation method • Aggregation net fluxes show larger uptake than tall tower, but close agreement when tall tower fluxes are decomposed and re-extended
Modeling Land Dynamics • Biome-scale biogeochemical models make each “cell” as a single plant functional type (or fractions of a few) with grid average values of biomass and fluxes • Age can only be modeled by following a cell with time as it builds up and loses biomass • Gap models simulate the growth and fate of every plant with explicit interaction among them • Computationally expensive, difficult to parameterize • The Ecosystem Demography model (ED) (Moorcroft et al., 2001) is a size-and-age structured gap model that uses concepts of statistical mechanics and Reynolds averaging to simulate the dynamics of the mean-moment ensemble of gaps • Single grid cell consists of multiple patches of different ages • Each patch contains multiple cohorts of size and plant type • Patch age affects light availability
Modeling Land Dynamics • Patches also differentiated by disturbance type • Equation for “advection-diffusion” of plant density with size and age • Driven by growth, mortality, aging and disturbance Source: Moorcroft et al., 2001 Source: Hurtt et al., 2002
Modeling Land Dynamics • Biogeochemistry driven by meteorology and standard Farquhar equations • Plants grow on allometry Source: Moorcroft et al., 2001
Modeling Land Dynamics • ED model parameterized to run in ChEAS region • Chamber flux data on leaf photosynthesis and respiration • Upper Midwest allometry functions • Forest Inventory Analysis data on mortality and harvest • Ramankutty (1999) land-use change data • STATSGO soil data • NCDC long term climate data – empirical functions used to simulate radiation and hourly data from daily data • 300 yr spin up from 1450-1750 • Separate runs for upland and lowland • Degree-day phenology / remote sensing for recent years • CENTURY model soil organic matter decay • Preliminary runs w/o forestry show large net flux to atmosphere in young stands and small sink in old stands in potential vegetation (northern pine / hemlock)
= LI-820 sampling from 75m above ground on communication towers. = 40m Sylvania flux tower with high-quality standard gases. = 447m WLEF tower. LI-820, CMDL in situ and flask measurements. Carbon Balance Budget • Network of high-precision CO2 can be used to estimate regional fluxes with mass-balance methods • Poor man’s inversion • Good for daytime, well-mixed conditions only • Data collected from 7 towers at 75m height in summer 2004 Courtesy of S. Richardson and S. Denning
Time scale Daytime Diurnal Annual Flux magnitude 1 to 10 mmol m-2 s-1 1 to 4 gC m-2 d-1 ~ 1 gC m-2 d-1 Mixing depth 1 to 2 km 1 to 2 km ~10 km Advection time ~10 hours ~24 hours Advection distance ~180 km (half ring) ~400 km (full ring) 400 km (full ring) Change in ABL CO2 1 to 5 ppm 2 to 5 ppm ~0.2 ppm Carbon Balance Budget • Ring can be used to infer daytime and diurnal fluxes
Carbon Balance Budget • Addition of towers lowers uncertainty compared to single tall tower regional budget Courtesy of M. Uliasz
Carbon Balance Budget • Net area surface flux can be diagnosed from • Time rate of change in volume • Horizontal inflow/outflow • Exchange between boundary layer and free troposphere
Carbon Balance Budget • Results are sensitive to boundary layer height • Will need to compare reanalysis TKE derived height versus CBL sounding and virtual potential temperature derived height • North American Regional Reanalysis transport fields • From NCEP, based on NGM analysis, 32km resolution • NOAH LSM used for surface fluxes (to gap fill observations) • Tropospheric CO2 • NOAA Viper (1/month) • COBRA (3 visits) • NASA INTEX (2 visits) • CalTech Column CO2 (daily) – will have soon Source: Desai et al., in press (2006)
Carbon Balance Budget • Preliminary results are encouraging • Daytime flux larger than tall tower, similar to other budgets • Hard to compute uncertainty compared to full inversion • 24-hr fluxes can be computed with LaGrangian method • Parcel followed from one tower to next, track change in concentration and location • Use hundreds of parcels with slight deviations • Use HYSPLIT model to map trajectory • Nighttime flux = 24 hr - daytime
Putting It All Together • Results show disturbance and management cause large variation in surface-atmosphere exchange across space and time • Young sites can be respiration hotspots • Old sites continue to be carbon sinks in an increasing CO2 world • Regional carbon flux scaling has to take into account variations in stand type and age • Land use history imprints itself on modern carbon flux • This type of analysis could also be applied to variables of meteorological interest such as water vapor and sensible heat flux • Wetlands continue to be a thorn in our side • Ongoing measurements in more wetlands and young stands • Need for a dynamic wetland model is evident
Novelty & Uniqueness • First multiple methods test on regional carbon balance in complex landscape • Development of footprint model that accounts of variation of roughness and displacement in space • First high-density regional multi eddy covariance tower variability assessment • One of few observational studies on whole ecosystem carbon balance and stand age • only one in Upper Midwest, USA • One of few tests of dynamic ecosystem model on regional scale • First regional terrestrial CO2 network mass balance attempt
Significance • Results from this work significantly advance our understanding of carbon balance at regional scales in managed, complex landscapes and convincingly show that sampling of dominant stands and modeling with coarse-resolution biogeochemical models limited to biome-scale parameters neither accurately capture observed variability of carbon fluxes nor match the inferred regional carbon flux • Small scale “hotspots” of production or respiration can be missed with linear scaling • Robust averages can be made, however, by modeling changes in probability distributions of stand age/type with time • Past land management and land use history affect the observed regional carbon balance today • This implies that future regional carbon exchange will be affected by land management decisions made today
Selected Publications • Desai, A.R., Bolstad, P., Cook, B.D., Davis, K.J. and Carey, E.V., 2005. Comparing net ecosystem exchange of carbon dioxide between an old-growth and mature forest in the upper Midwest, USA. Agricultural and Forest Meteorology, 128(1-2): 33-55 (doi: 10.1016/j.agrformet.2004.09.005) • Cook, B.D., Davis, K.J., Wang, W., Desai, A.R., Berger, B.W., Teclaw, R.M., Martin, J.M., Bolstad, P., Bakwin, P., Yi, C. and Heilman, W., 2004. Carbon exchange and venting anomalies in an upland deciduous forest in northern Wisconsin, USA. Agricultural and Forest Meteorology, 126(3-4): 271-295 (doi:10.1016/j.agrformet.2004.06.008) • Desai, A.R., Noormets, A., Bolstad, P.V., Chen, J., Cook, B.D., Davis, K.J., Euskirchen, E.S., Gough, C.M., Martin, J.M., Ricciuto, D.M., Schmid, H.P., Tang, J. and Wang, W., accepted. Influence of vegetation and climate on carbon dioxide fluxes across the Upper Midwest, USA: Implications for regional scaling, Agricultural and Forest Meteorology • Heinsch, F.A., Zhao, M., Running, S.W., Kimball, J.S., Nemani, R.R., Davis, K.J., Bolstad, P.V., Cook, B.D., Desai, A.R., et al., in press. Evaluation of remote sensing based terrestrial producitivity from MODIS using regional tower eddy flux network observations, IEEE Transactions on Geosciences and Remote Sensing
Selected Publications • Desai, A.R., Davis, K.J., Senff, C.J., Ismail, S., Browell, E.V., Stauffer, D.R. and Reen, B.P., in press. A case study on the effects of heterogeneous soil moisture on mesoscale boundary layer structure in the southern Great Plains, USA. Part I: Simple prognostic model, Boundary-Layer Meteorology • Yi, C., Li, R., Bakwin, P.S., Desai, A.R., Ricciuto, D.M., Burns, S., Turnipseed, A., Wofsy, S.C., Munger, J.W., Wilson, K. and Monson, R.K., 2004. A nonparametric method for separating photosynthesis and respiration components in CO2 flux measurements. Geophysical Research Letters, 31(L17107): doi:10.1029/2004GL020490 • Yi, C., Davis, K.J., Bakwin, P.S., Denning, A.S., Zhang, N., Desai, A.R., Lin, J.C. and Gerbig, C., 2004. Observed covariance between ecosystem carbon exchange and atmospheric boundary layer dynamics at a site in northern Wisconsin. Journal of Geophysical Research - Atmospheres, 109(D08302): doi: 10.1029/2003JD004164 • Noormets, A.N., Ricciuto, D.M., Desai, A.R., Cook, B.D., Chen, J., Davis, K.J., Bolstad, P.V., Euskirchen, E., Curtis, P.S. and Schmid, H.P., submitted. Moisture sensitivity of ecosystem respiration: Comparison of 14 forests in the Upper Great Lakes Region, USA, Agricultural and Forest Meteorology
Plan For Finishing • Sept: ED model, pre-defense, ICDC7 conference, revise Desai et al - multisite • Oct: Top-down model, fieldwork, job applications • Nov: Finish results from ED model and Top-down model • Dec: AGU, postdoc fellowship apps, writing • Jan: Redo tower footprints and update chapter, writing • Feb: finish primary dissertation draft, send to comm. • Mar: defend, party, revise • Apr: submit, graduate, publish, party • and then: onward!
Acknowledgments • Ph.D. advisor: Ken Davis • Ph.D Committee: Ray Najjar, John Wyngaard, Toby Carlson, Brent Yarnal • Davis lab: Bruce Cook (U. MN), Weiguo Wang, Scott Richardson, Tasha Miles, Chuixiang Yi (U. CO.), Dan Ricciuto, Kelly Cherrey, Jon Zawislak, Martha Butler and everyone else • Land owners, site technicians, field crew, engineers • Funding agencies: • DOE (OBER / TCP) and DOE NIGEC (now NICCR) • NASA Earth Science and PSU Space Grant • USDA – U.S. Forest Service – GCRP & NCRS • NOAA CMDL • NSF Research Collaboration Network • and…
Acknowledgments • External collaborators: • U. Minnesota: Paul Bolstad, Eileen Carey, Jianwu Tang, Leslie Kreller • U.S. Forest Service: Ron Teclaw, Dan Baumann • U. Montana: Faith-Ann Heinsch, Steve Running • Oregon State U.: Jon Martin, Larry Mahrt, Hank Loescher • Harvard U.: Paul Moorcroft, Marco Albani, Dan Lipsitt, Steve Wofsy • Colorado State U.: Scott Denning, Marek Uliasz • University of Toledo: Jiquan Chen, Asko Noormets • NASA: Stephanie Vay, Ed Browell • NOAA: Pieter Tans, Arlen Andrews, Peter Bakwin • CalTech: Rebecca Washenfelder, Paul Wennberg • Ohio State: Chris Gough, Peter Curtis • Indiana U.: Ha-Pe Schmid • U. Alaska – Fairbanks: Eugenie Euskirchen • Max-Planck BGC Inst: Antje Moffat • U. Wisconsin: Doug Ahl, Tom Hayes, Sean Burrows • and many others!
What a Load! Thank you!