2010 Ozone Season Summary and Air Quality Analysis
60 likes | 178 Vues
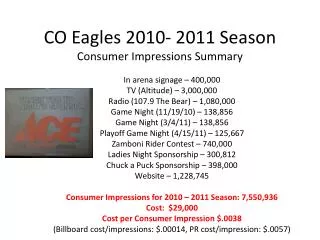
This document presents a summary of the 2010 ozone season, detailing peak 8-hour ozone concentrations and related air quality data as of July 12, 2010. Key findings include 1 Code Red day, 16 Code Orange days, 20 Code Yellow days, and 35 Code Green days based on the 8-hour ozone standard set at 75 ppb. Additionally, fine particle (PM2.5) data is summarized, indicating 3 Code Orange days and 51 Code Green days. The report highlights a period of poor air quality from July 3-8, caused by high pressure, light winds, and limited clouds, which intensified ozone levels.

2010 Ozone Season Summary and Air Quality Analysis
E N D
Presentation Transcript
Ozone Season Summary 2010 Sunil Kumar TAC Meeting, COG July 13, 2010
Ozone Season Summary (2010) Peak 8-Hour Ozone Concentrations (ppb) Data based on the 8-hour standard set at 75 ppb. 1 Code Red Day 16 Code Orange Days 20 Code Yellow Days 35 Code Green Days * Analysis is based on draft data until July 12, 2010. Data is subject to change.
2010 Ozone Exceedances * Analysis is based on draft data until July 12, 2010. Data is subject to change.
Fine Particle Summary (2010) 24-Hour PM2.5 Concentrations (ug/m3) Data based on the 24-hour standard set at 35.5 ug/m3. 3 Code Orange Days 18 Code Yellow Days 51 Code Green Days * Analysis is based on draft data until July 12, 2010. Data is subject to change.
Poor Air Quality Event (July 3 - July 8) • High pressure led to conditions favorable to high ozone • levels. • Winds were light and usually re-circulating polluted air • back into the region. • Clouds were limited, allowing for intense sunlight (and • record temperatures). • The jet stream during this period was flowing from the • South West up into Canada, guiding low pressure • systems to our north where they were unable to clean • out the air mass that remained overhead.
July 7th Code Red # of Monitors in Exceedance: 13 Maximum 8-Hour Ozone: 100 ppbv 2 Monitors: Code Red Back Trajectory at 3 PM (500 &1000 m)