2014 Ozone Season Summary and Fine Particle Analysis
170 likes | 302 Vues
The report summarizes the 2014 ozone season up to September 3, highlighting key air quality metrics. It notes 4 Code Orange days, 39 Code Yellow days, and 112 Code Green days. Meteorological factors contributing to ozone exceedance on August 6 and 27 include high temperatures of 90°F and northwesterly winds bringing ozone precursors. The document also discusses fine particulate matter (PM2.5), recording 49 Code Yellow days and 106 Code Green days. Emission control programs impact these trends and factors contributing to exceedance days are analyzed. Data is subject to change.

2014 Ozone Season Summary and Fine Particle Analysis
E N D
Presentation Transcript
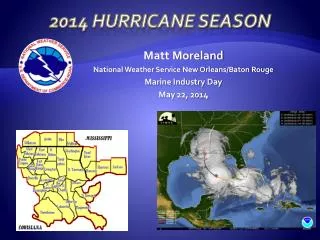
Item #2 Ozone Season Summary 2014 Sunil Kumar MWAQC-TAC Meeting, COG September 9, 2014
Ozone Season Summary [As of September 3, 2014] Peak 8-Hour Ozone Concentrations (ppb) Data based on the 8-hour standard set at 75 ppb. Since April 1, 2014, there have been: 4 Code Orange Days, 39 Code Yellow Days, 112 Code Green Days
Meteorology Factors on Exceedance Days • August 6, 2014 • High Temperature: 90°F • Light winds • Northwesterly winds brought NOx and ozone from the Ohio River Valley • Clear Skies due to a high pressure system • Similar conditions during the two days prior caused ozone to build up • August 27, 2014 • High Temperature: 90°F • Northwesterly winds brought NOx and ozone from Western PA and OH • High ozone values in Western PA on August 26 • Clear and sunny skies
Ozone Concentration at 3 PM August 26 Ozone concentrations = 70-80 ppb 24 – 32 hours
Ozone Concentration at 3 PM August 27 Ozone concentrations = 70-90 ppb
2014 Ozone Exceedances • Analysis is based on draft data until September 3, 2014. Data is subject to change.
Ozone Exceedance Trend • 2014 analysis is based on draft data as of September 4, 2014 and is subject to change.
90 Degree Days and Exceedance Days • 2014 analysis is based on draft data as of September 3, 2014 and is subject to change.
Why Fewer ExceedanceDays Now ? • Emission Control Programs
These 4th highest 8-hour ozone values in 2015 would lead to non-attainment in 2015 • Analysis is based on draft data until September 3, 2014. Data is subject to change.
Fine Particle Summary [As of September 3, 2014] 24-hour PM2.5 Average (µg/m3) Data based on the 24-hour standard set at 35 µg/m3. Since April 1, 2014, there have been: 49 Code Yellow Days, 106 Code Green Days