Download
1 / 32
320 likes | 420 Vues
This summary and critique discuss human population trends and projections for the next 50 years, exploring demographic uncertainties and potential implications on resources and society. It highlights historical population growth, current global trends, fertility rates, urbanization, and projections for the year 2050. The text analyzes factors influencing demographic changes, such as economies, the environment, and cultures, and emphasizes the importance of addressing challenges in areas like food, housing, education, health, and employment to ensure a sustainable future.

E N D
State of the Planet:Human Population: The Next Half Century Chun-yip Yeung - Summary Tony Chen - Critique EE 563—Graduate Seminar Reference: SCIENCE, November 14, 2003 Issue Joel E. Cohen
Introduction • Main Question: • Facing increasing global population and limited resources, can we continue to prosper—to have enough resources to support future generations to come? How about for these 50 years (i.e. our career period)?
Introduction – Cont. Outline of the Summary • 1) Examines current state of human population 2) Predicts the population changes for the next 50 years 3) Demographic Uncertainties • Further: what can we, as EE, do to prepare for our common future?
Current Demographic State
Current State-Past Population • Past Population: • Earth’s population grew about 10-fold: • 600 million people in 1700 to 6.3 billion in 2003 (estimated) • 1927: 2 billion people • 1974: 4 billion people • 1999: 6 billion people • This is our first time to handle this large number of people and we lack the experience.
Current State-Global Trends • Rapid growth • Europe and the New World: 1750 to 1950 • Asia, Middle East, and Africa: 1950 current • Worldwide effort to make contraception and reproductive health service available • Improvements in the survival of infants and children • Widespread economic development and integration • Movement of women into the paid labor market • Increases in primary and secondary education for boys and girls • Other cultural changes
Current State-Fertility rate • Fertility rate: • 1960: 5 countries has the rate at or below the level required to replace the population • 2000: 64 countries—about 44% of all people
Current State—Urban and Population • Urbanization: • 1800: 2% of people • 1900: 12% • 2000: more than 47%--10% of them live in cities with 10 million people or larger => 1800 to 1900: 11-fold, from 18 million to 200 million => 1900 to 2000: 14-fold, from 200 million to 2.9 billion • Population in cities: • 1950: New York had 10 million people or more • 2000: 19 cities had 10 million people or more
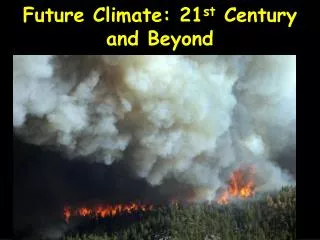
Demographic Projection of the Next 50 Years (to Yr. 2050) • Projection: • Yr. 2050 • Human population would be larger by 2-4 million people • More slowly growing (declining in the more developed regions) • More urban • More older than in the 20th century • Two major demographic uncertainties concerning • International migration • Structure of family • Three factors that influences demographic changes: • Economies • Nonhuman environment • Cultures (values, religions, and politics)
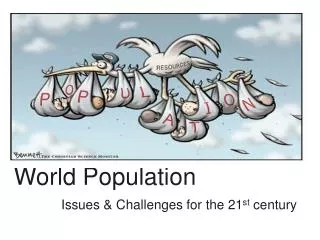
Projection-Population 1 • This projection is prepared by the United Nations Population Division, the World Bank, the United States Census Bureau, and some research institutions. • According to the medium variant, • World’s population is expected to grow from: • 2003: 6.3 billion to • 2050: 8.9 billion • This increase (8.9 billion - 6.3 billion = 2.6 billion) exceeds the total population of the world in 1950 (2.5 billion)
Projection-Population 2 • Current absolute and relative global population growth rates: • 77 million per year => challenge: food housing, education, health, employment, political organization and public order. • More than half of the increase comes from the following countries: India, China, Pakistan, Bangladesh, Nigeria, and the United States.
Projection- Fertility Rate • Fertility Rate: • At present rate, the population would grow to 12.8 billion by 2050 • “8.9 billion in 2050” – this figure assumes: • Efforts for family planning continue, and this plan succeeds • “High-risk behaviors related to AIDS will become less frequent and chances of infection among those engaging in high risk behaviors will decline.”
Projection- Average Population Density • Average Population Density: • World’s: • 2000: 45 people / km sq. • 2050: 66 people / km sq. • Rich countries: • 2000: 23 people / km sq. • 2050: remains the same • Poor countries • 2000: 59 people / km sq. • 2050: 93 people / km sq. => this poses problems in land use and preservation
Projection- Implications of Different Grow Rate between Rich Countries and Poor Countries 1 • Implications of Different Grow Rate between Rich Countries and Poor Countries: • Affects population size and age structure • If the population growth is slow—balancing the number births and deaths: • Number of people in the younger age group = Number of people in the older age group
Projection- Implications of Different Grow Rate between Rich Countries and Poor Countries 2 • Illus. Population Pyramid: • Column-shaped= Slowly growing population • Triangular = rapidly growing population Figure 1: Age Distribution of 25 Countries in Europe and 25 Countries in West Asia and Africa
Projection- Implications of Different Grow Rate between Rich Countries and Poor Countries 3 • Further Implication: • Supplies of military personnel and ratios of elderly to middle-age
Projection- Global Life Expectancy • Global Life Expectancy: • 2000-2005: 65 years • 2045-2050: 74 years • Rich Countries: 76 years to 82 years • Poor Countries: 63 years 73 years
Projection- Urban / Rural Population • Urban / Rural Population: • Projection: more than half of all people will live in cities • Projection: rural population remains at 3 billion people • Trend: Population increases most in urban areas. • Urbanization: • Rich: • 2000: 75% of people • 2030: 83% of people • Poor: • 2000: 40% of people • 2030: 56% of people
Projection- Issues • Issues: • Aging: • Projection: More portions of population are in the elderly group. • Current: 2000 • Age under 4: 10.2% of global population • Age 60 and over: 10.0% of global population • Projection: 2050 • Age under 4: 6.6 % of global population • Age 60 and over: 21.4% of global population • Ratio: 3.2 elderly for every child • Reasons: • Improved survival, raising the average length of life • Reduced Fertility
Demographic Uncertainties • Demographic Uncertainties: Migration and the Family • Uncertainty: • Available Data are Sparse and Partial • Rapid Changes in • Economic • Geopolitical or Security Factor ðDifficult to project migration • Migration—from less-developed to more-developed countries • Current: 2.6 million annually • 2025-2030: 2.0 million annually • 1.1 million are anticipated to come to U.S.
Future Family Structure • Family Structure: • Difficult to predict. • Goldscheider: • Fall of fertility weakens the tie between men and women • Rise in divorce and cohabitation weaken the tie between fathers and children • More non-martial births • Remarriage and step-families are becoming more common • One-child family would be common => the child would have no sibling, uncle, aunt, nor cousins. • An adult who has children between age 20-30 would have longer time with his children due to the longer lifespan.
Conclusion • We’ve seen the current state on the population, and we’ve seen the projection by the U.N. • What are some of your thoughts or comments? • As an EE, how can we prepare for the future?
Critique • Good report overall • Reputable sources • UN population division • World bank
Critique • Predictions: • Reasonable • But is it accurate? • 8.9 Billion in 2050?
Critique • Uncertainties • International migration • Family structure • U.S. divorce rate 60%
Critique • Gender Selection • China and India: 2.3 billion people • Parents prefer boys • Ultrasound lets parents choose • China’s one child policy = girls get aborted • Current sex ratio 12 men : 10 women
Critique • Predictions vary • 2001 report: 9.3 billion people in 2050 • Now: 8.9 billion • Next few years: 8 billion?
Critique • Questions?