Census Data and Montana Indian Reservations
390 likes | 553 Vues
Census Data and Montana Indian Reservations. Pam Harris Bureau Chief Census and Economic Information Center Montana Department of Commerce. CEIC – Who We Are.

Census Data and Montana Indian Reservations
E N D
Presentation Transcript
Census Data and MontanaIndian Reservations Pam HarrisBureau ChiefCensus and Economic Information CenterMontana Department of Commerce
CEIC – Who We Are • Partnership with U.S. Dept. of Commerce, Census Bureau and Bureau of Economic Analysis to disseminate Montana data collected by federal agencies • Cvs.C staff provide demographic and economic data and analysis, GIS support, technical assistance and training. • Assist Montana businesses, communities schools, and all government agencies to access and use this information for decision-making.
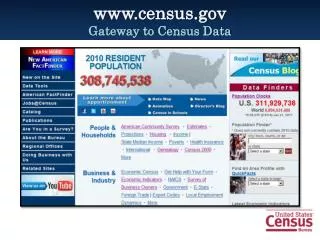
Why Census Data? • Census data is unique • Only source for small area data (reservation, cities/towns, tribal census tracts, etc.) • Only source which shows characteristics for the population such as age, race, gender, educational attainment, income, labor force, types of households, etc. • Census results are used to distribute almost $200 billion annually in federal, state, local, and tribal funds
Examples of American Indian Federal Programs Relying on Census Data • Workforce Investment Program • Community Development Block Grants (CDBG) • Supplemental Food Program for Women, Infants and Children (WIC) • Temporary Assistance to Needy Families • Low Income Energy Assistance
How can data help? • Census data helps tribal planners evaluate conditions on their reservations and in their communities. • Tribal governments, states, cities, federal agencies, and businesses all need current information to make critical decisions. • Data can help decide what services are needed and how to distribute funding for housing, economic development, health care, and other programs that benefit veterans, children, families, the elderly and the society as a whole. • Census data is an important tool for tribal government decision-making and could result in improved utility services, new housing, job training, better school facilities, or a new health clinic to benefit you, your family, your community or reservation.
More current data coming.. • American Community Survey (ACS) will replace the decennial census long form questionnaire producing the socio-economic data every year instead of every 10 years. • Example – Workforce Investment Act of 1998 requires information about American Indian and Alaska Native households to support training and employment activities. ACS will provide this critically important information. • ACS has been endorsed by the Indian and Native American Employment and Training Coalition and the National Congress of American Indians. • Flathead and Lake Counties have been a successful part of the early ACS testing for the last six years.
Census 2010 Pilot project in South Dakota, Cheyenne River Reservation • An accurate and complete count of the population in 2010 will enable American Indians to receive the correct share of federal and state resources that are based on census data • Pilot project is testing new counting methods; setting standard for how the Census Bureau counts American Indians all over the U.S. • American Indians have been undercounted in previous censuses, and the mutual goal of the Census Bureau and the American Indian community is to reverse that trend in 2010.
Montana Reservations Accurate Data Federal Statistical Agencies Statistics EconomicDevelopers Grant Writers SocialServiceAgencies Planners $ for Montana Reservations
Summary • Federal monies are getting harder to obtain. Data users need to be smarter about using the information available to help secure essential funding for tribal programs. • Without accurate, reliable, and current information, detailed analysis of Indian Reservations’ Economies’ will be more difficult. • Need to work together, take ownership of the data, to ensure that the American Community Survey and the 2010 Census are the best they can be, which will ultimately benefit everyone.
Analyzing Montana’s Indian Reservations’ Economies Susan Ockert Senior Research Economist, Census and Economic Information Center, Montana Department of Commerce
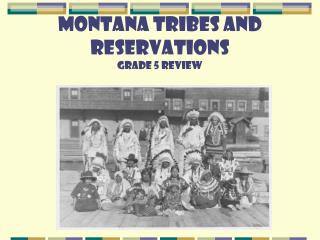
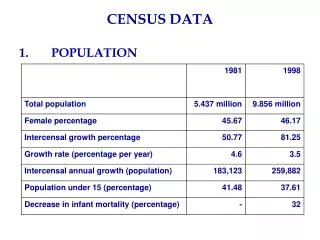
Daniels Glacier Sheridan Hill Blaine Flathead Phillips Roosevelt Pondera Valley Sanders Lake Chouteau Missoula Rosebud Yellowstone Big Horn 2000 Census Data SOURCE: U.S. CENSUS BUREAU, CENSUS 2000
Population by American Indian and by Tribe: Source: U.S. Census Bureau, Census 2000
American Indian Population: Urban vs. Rural Urban = 1,000 people per square mile *Metropolitan Areas: Billings, Great Falls, Missoula **Concentrations of population, housing, and commercial structures that are identifiable by name but have no legal authority. Source: U.S. Census Bureau, Census 2000
What is an ‘economy’? Jobs Income Businesses • Public Goods • Zoning/Land Use • Public Finance • Public Safety Consumers Government Create Wealth • Marketing • Customer Service • Accounting • Management Source: “Understanding Your Community’s Economic Base, ” University of Missouri Extension, http://muextension.missouri.edu Redistribute Wealth
Population Faster growth rate Younger median age Education Fewer with degrees Higher drop out rate Social Larger percent of population uses food stamps Higher pregnancy rate Higher alcohol treatment need Current Reservation Environment Sources: See last page
Current Reservation Economies • Higher unemployment • More poverty • Lower per capita income • Lower wages • Lower housing values • Smaller private sector Sources: See last page
Types of Jobs • 33% of jobs on the reservation are Government compared with 15% of jobs in the country as a whole • 44% of jobs on the reservation are in the Private Sector compared with 80% of jobs in the nation Source: Federal Reserve Bank of Minneapolis, fedgazette, March 2006
Business Environment NOTE: AI = American Indian Source: U.S. Census Bureau, “Survey of Business Owners”
Threshold Analysis • Central Place Theory - Population needed to support retail and service businesses • Simple Analysis: population and number of businesses • Similar characteristics such as population & location • Does not take into account economies of scale • Square footage • Number of doctors in one facility • Grocery store • Health care • Financial Institutions
On the Reservation: Browning, Wolf Point, Ronan Just Off the Reservation: Cut Bank, Hardin, Glasgow Trade Center: Havre, Miles City, Glendive Metropolitan: Missoula, Great Falls, Billings and Helena Grocery Stores # Number of Businesses *Number of Businesses using statewide threshold of 2,725
On the Reservation: Browning, Wolf Point, Ronan Just Off the Reservation: Cut Bank, Hardin, Glasgow Trade Center: Havre, Miles City, Glendive Metropolitan: Missoula, Great Falls, Billings and Helena Health Care: Doctors and Clinics # Number of Businesses *Number of Businesses using statewide threshold of 509
On the Reservation: Browning, Wolf Point, Ronan Just Off the Reservation: Cut Bank, Hardin, Glasgow Trade Center: Havre, Miles City, Glendive Metropolitan: Missoula, Great Falls, Billings and Helena Financial Institutions # Number of Businesses *Number of Businesses using statewide threshold of 1,227
Implications • Reservations are underserved in these private sectors • Just Off the Reservation serving own population and reservation • Trade Centers and Metropolitans serve a much larger region
Location Quotient • Determine if number of jobs are what a local economy should have to serve local needs • Comparison of local employment to statewide for each industry • < 1 = underserved, > 1 = serving more than local • MT Department of Labor and Industry, Research and Analysis has calculated LQ for each county in Montana (www.ourfactsyourfuture.mt.gov)
Comparisons • State • – Most over served: Mining except Oil & Gas at 5.7 • – Most under served: Textile Mills at .06
Implications • Money is leaving the reservations to purchase retail goods and consumer services • There is not an adequate supply of financial services on the reservations • There is not an adequate supply of doctors, clinics, etc. on the reservations
Diversity of Economy • Hachman Index measures diversity of economy – employment spread out among many different industries compared to benchmark • Montana or United States • More diversity reduces community’s vulnerability to economic downturns • Closer to 1 mean more diversity • MT Department of Labor and Industry, Research and Analysis has calculated HI for each county in Montana (www.ourfactsyourfuture.mt.gov)
Hachman Index • Fort Peck Reservation = .24 • Blackfeet Reservation = .14 County Hachman Indices • Lowest (Stillwater) = .01 • Median = .25 • (McCone, Phillips, Toole) • Highest = .66 • (Gallatin, Missoula, Cascade)
Implications • Reservation and county economies are not diverse • ‘One company’ towns
Vibrancy of Economy • *Reference USA • 921: Executive, Legislative and • Other government support. • Excludes • Law enforcement, public health NOTE: Red is off the reservation Sources: Reference USA, www.referenceusa.com, U.S. Census Bureau, Zip Code Business Patterns, 2002 and 2003
Productivity – Measure of Efficiency Average Output per Worker (IMPLAN) Minnesota IMPLAN Group, www.implan.com
Compensation per Worker Average Salary per Worker (IMPLAN) Minnesota IMPLAN Group, www.implan.com
Reservation Natural Resources • Montana Reservations compared to U.S. Reservations • 13% of all acres of coal • 12% of all oil and gas leases • 5% of all coal royalties/revenues • 5% of oil royalties/revenues
Agriculture on the Reservation * Due to confidential information, only 6 reservations used United States Department of Agriculture, National Agricultural Statistics Service, http://www.nass.usda.gov/Census_of_Agriculture/index.asp
Summary With legal and policy foundation and data collection: • Reservations have potential to expand private business sectors • Reservations have natural resources, especially for energy generation, to use as economic engines • American Indian farmers appear to have comparative advantage in farming
Contact Information Susan Ockert Senior Research Economist (406) 821-2740 sockert@mt.gov www.ceic.mt.govPowerPoint presentation available on CEIC’s web site at www.ceic.mt.gov/presentations.asp and MEDA’s web site at www.medamembers.org/memdir.php
NOTES: BA+: Bachelor’s and Advanced Degrees Pregnancy Rate: Pregnancies per 1,000 teens, aged 15-19 Alcohol Treatment Need: Index that includes alcohol mortality and alcohol-defined arrest rates SOURCES: • Reservation Data: U.S. Census Bureau, Census 2000; US Department of Interior, Bureau of Indian Affairs, 2003; MT Department of Labor and Industry, Research Analysis Bureau, 2005 • Population: U.S. Census Bureau, Population Estimates Program, July 1, 2004 Estimates • Unemployment: MT Department of Labor and Industry, Research and Analysis Bureau, Labor Day Report 2005 • Per Capita: US Department of Commerce, Bureau of Economic Analysis, 2003 • Poverty: U.S. Census Bureau, Small Area Income & Poverty Estimates, 2002 • Housing Value: U.S. Census Bureau, Census 2000 • Median Age: U.S. Census Bureau, Census 2000 • % Food Stamps: MT Department Public Health and Human Services, Statistical Report June 2005 • Pregnancies: MT Department of Public Health and Human Services, Trends in Montana Teen Pregnancies and Their Outcomes 1981-2000, November 2002 • Alcohol treatment Need: MT Department of Public Health and Human Services, An Integrated Substance Abuse Treatment Needs Assessment for Montana, 2001 • Drop Out: Office of Public Instruction, Montana High School Dropout Rates by Race/Ethnicity, 2003-04 School Year • Source: U.S. Census Bureau, Census 2000 American Indian and Alaska Native Summary File (AIANSF) – Sample Data, www.ceic.mt.gov/C2000/allreservationsbytribe.xls • Source: U.S. Census Bureau, Census 2000 Summary File 2, Matrix PCT1. www.ceic.mt.gov/C2000/urban_rural_indian.xls