Download
1 / 47
470 likes | 578 Vues
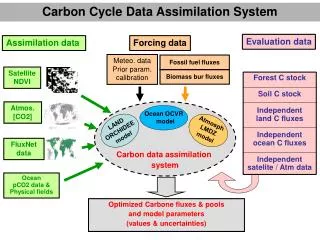
This research by Mathew Williams from the University of Edinburgh and the National Centre for Earth Observation explores the integration of data assimilation methods to refine our comprehension and forecasting capabilities regarding the terrestrial carbon cycle. By analyzing various ecological and climate models alongside observational data from multiple sources, the study identifies shortcomings in model parameterization and initial conditions, aiming to improve the accuracy of carbon flux predictions. The findings have significant implications for climate science and carbon management strategies.

E N D
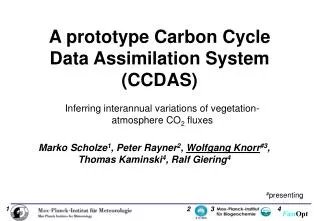
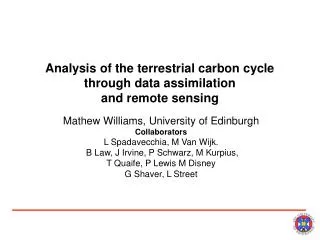
Using data assimilation to improve understanding and forecasts of theterrestrial carbon cycle Mathew Williams School of GeoSciences, University of Edinburgh And National Centre for Earth Observation
Sampling at 3397 meters, well mixed free troposphere Source: CD Keeling, NOAA/ESRL
THE BIOLOGICAL GLOBAL CARBON CYCLE (1750) - 1 Pools (billions of tonnes C) & fluxes ( billions of tonnes C yr ) Source: Schlesinger (1997), Schimel et al. (1995), Reeburgh (1997) 120 Atmosphere GPP 540 60 60 R 90 90 A 650 R H 0.4 Surface DOC 40 POC 7 o Soils Deep ocean DOC 700 1580 DIC 38000 0.1 Sediments 75,000,000
THE MODERN GLOBAL CARBON CYCLE (2000) - 1 Pools (billions of tonnes C) & fluxes ( billions of tonnes C yr ) Source: Schlesinger (1997), Schimel et al. (1995), Reeburgh (1997) 6 120? Atmosphere GPP 720 (+3.2/yr) 60 60 R 92 90 A 600 1.4 R H 0.4 Net destruction Unattributed Surface DOC 40 POC 7 o f vegetation C sink 1.6 Soils Deep ocean DOC 700 1580 DIC 38000 0.1 Sediments 75,000,000
Intercomparison of 11 coupled carbon climate models Friedlingstein et al 2006: C4MIP
Problems with models Poor parameterisation Missing processes Inaccurate initial conditions Solution: make and break models with observations?
Time and space scales in ecological processes time dec Climate change Succession yr Adaptation Disturbance month Growth and phenology day Climate variability Photosynthesis and respiration hr Flask Site Physiology s Space (km) 0.1 1.0 10 100 1000 10000
Time and space scales in ecological observations time dec Flask Site OCO MODIS yr month Flux Tower Tall tower day Field Studies Aircraft hr Flask Site s Space (km) 0.1 1.0 10 100 1000 10000
Observing networks: CO2 Fluxes FluxNet - ~200 eddy covariance systems
Hourly data ~5 m above canopy Source: Wofsy et al, Harvard Forest LTER
Tall Tower ‘Angus’ CO2 CH4 N2O SF6 CO H2 222Rn at 222 m • Li-7000 • Agilent 6890 FID & ECD • TGA3 at 50 m • ANSTO Radon • T and RH at 220,100, 50 and 5 m agl • P, u and wind directionat 5 m agl Photo: T Hill & T Wade
SCIAMACHY CO2 [P Monks] MODIS EVI [NASA] Barkley et al, [2006] Airborne LIDAR biomass [C Nichol] A range of Earth observation data
FUSION ANALYSIS ANALYSIS + Complete + Clear confidence limits + Capable of forecasts Improving estimates of C dynamics MODELS MODELS + Capable of interpolation & forecasts - Subjective & inaccurate? OBSERVATIONS +Clear confidence limits - Incomplete, patchy - Net fluxes OBSERVATIONS
Modelling C exchanges Af Lf Cfoliage Rh Ra Ar Lr GPP Croot Clitter D Aw Lw Cwood CSOM/CWD
Senescence & disturbance Photosynthesis & plant respiration Phenology & allocation Microbial & soil processes Af Lf Cfoliage Rh Ra Ar Lr GPP Croot Clitter D Climate drivers Aw Lw Cwood CSOM/CWD Non linear functions of temperature Feedback from Cf Simple linear functions
Exploring model behaviour • Sensitivity to initial conditions • Parameter sensitivity • Steady state solutions • A master’s study by Tom Ilett • Supported by Sarah Dance, Jon Pitchford, Nancy Nichols
Sensitivity of pools and NEE to altered initial conditions of Cf
NEE sensitivity to varying initial conditions over 3 years Cr - roots Cw - wood Clit - litter Csom – soil organic matter
Parameter details Parameter sensitivity
The steady state solution Assume climate inputs are constants ForDCf = 0 The equilibria for the other stocks are linear functions of G and Cf
There are three fixed points for GPP and Cf , for Cf 0; 50; 450.
NEE trajectories 12 yrs 250 yrs 2000 yrs Evolution of NEE 0, time constant depends on stabilisation of Csom
Relationship between GPP, Cf and time – an indicator of phenology?
Convergence to attracting orbit for a 15 year projection. Trajectories become darker as time progresses – final year is a black line
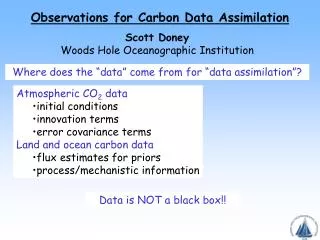
Combining models and observations • Are observations consistent among themselves and with the model? • What processes are constrained by observations?
The Kalman Filter Initial state Drivers Forecast Observations Predictions At Ft+1 Dt+1 F´t+1 MODEL OPERATOR P Assimilation Ensemble Kalman Filter At+1 Analysis
Data brings confidence =observation — = mean analysis | = SD of the analysis Williams et al, GCB (2005)
Reflex experiment • Objectives: To compare the strengths and weaknesses of various model-data fusion techniques for estimating carbon model parameters and predicting carbon fluxes. • Real and synthetic observations from evergreen and deciduous ecosystems • Evergreen and deciduous models • Multiple MDF techniques www.carbonfusion.org
Parameter constraint Consistency among methods Confidence intervals constrained by the data Consistent with known “truth” “truth”
Parameter retrieval for EV ID Param d1 d2 d3 D Rank Bias p1 Td 0.26 0.36 0.75 0.87 11 1 p2 Fg 0.30 0.41 0.02 0.51 6 3 B p3 Fnf 0.07 0.49 0.00 0.50 5 4 A p4 Fnrr 0.24 0.65 0.31 0.76 9 1 p5 Tf 0.06 0.20 0.03 0.21 1 4 A p6 Tw 0.22 0.40 0.69 0.83 10 0* p7 Tr 0.27 0.52 0.03 0.59 8 4 p8 Tl 0.07 0.22 0.03 0.23 2 3 p9 Ts 0.05 0.16 0.21 0.27 4 0* p10 Et 0.04 0.24 0.00 0.24 3 4 p11 Pr 0.21 0.47 0.15 0.54 7 2 B Mean 0.16 0.38 0.20 0.51 d1. Consistency among methods: s(m1,…,m9)/(pmax-pmin) d2. CIs constrained by the data: m(CI1,…,CI9)/(pmax-pmin) d3. Consistent with truth : |t-m(m1,…,m9)|/(pmax-pmin) mi=estimate by method i, p=prior, t=truth. D = m(d1,d2,d3). A, B indicate correlations
Parameter summary • Parameters closely associated with foliage and gas exchange are better constrained • Parameters for wood and roots poorly constrained and even biased • Similar parameter D values for synthetic and true data • Correlated parameters were neither better nor worse constrained
Testing algorithms & their confidence Re GPP NEE Confidence interval (gC m-2 yr-1) Fraction of successful annual flux tests (3 years x 2 sites, n=6)
State retrieval summary • Confidence interval estimates differed widely • Some techniques balanced success with narrow confidence intervals • Some techniques allowed large slow pools to diverge unrealistically
Conclusions • Attractor analysis is a useful technique for understanding C models • Model data fusion provides insights into information retrieval from noisy and incomplete observations • Challenges and opportunities: • introducing stochastic forcing • Linking other biogeochemical cycles • Designing optimal sensor networks • Theoretical understanding of plant process
= observation — = mean analysis | = SD of the analysis Time (days since 1 Jan 2000) Williams et al GCB (2005)
= observation — = mean analysis | = SD of the analysis Time (days since 1 Jan 2000) Williams et al GCB (2005)