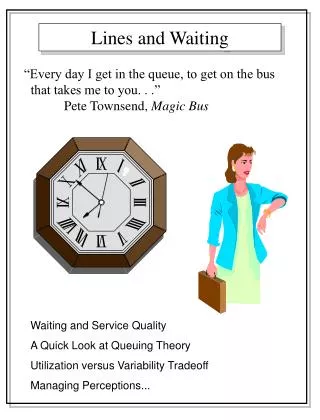
Waiting Lines and Queuing Models
Waiting Lines and Queuing Models. Queuing Theory. The study of the behavior of waiting lines Importance to business There is a tradeoff between faster lines and increased costs faster lines suggests an increase in service, thus an increase in costs


Waiting Lines and Queuing Models
E N D
Presentation Transcript
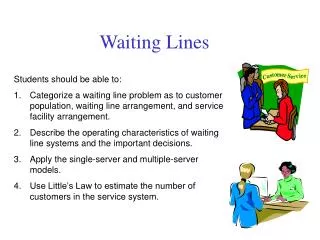
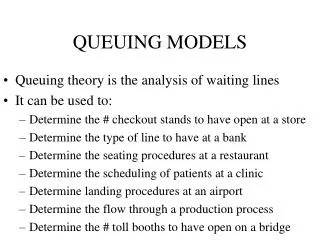
Queuing Theory • The study of the behavior of waiting lines • Importance to business • There is a tradeoff between faster lines and increased costs • faster lines suggests an increase in service, thus an increase in costs • longer waiting times negatively affects customer satisfaction • What is the ‘ideal’ level of services that a firm should provide?
Management Uses from Queuing Theory • Is it worthwhile to invest effort in reducing the service time? • How many servers should be employed? • Should priorities for certain types of customers be introduced? • Is the waiting area for customers adequate? • Answers to these questions can be obtained with • Analytic methods or queuing theory (formula based); and • Simulation (computer based).
Queuing System Characteristics • Arrivals • Waiting in Line • Service Facility
Arrival Characteristics • Size of the calling population • Finite: ex. 300 computers on campus maintained by 5 computer technicians (customers arriving for service are limited) • Infinite: ex. cars arriving at a highway tollbooth, shoppers arriving at a supermarket (the source is forever “abundant”) • Pattern of Arrivals • Nonrandom: arrivals take place according to some known schedule (ex. assembly line) • Random: arrivals are independent and cannot be predicted exactly
Random Pattern of Arrival • Poisson Distribution • a probability distribution that can be used to determine the probability of X transactions arriving in a given time interval P(X) = for X = 0, 1, 2, 3, 4 where, P(X) = probability of X arrivals X = number of arrivals per unit of time = average arrival rate e = 2.7183 e- X X!
0.25 0.20 0.15 0.10 0.05 0 1 2 3 4 5 6 7 8 9 10 11 = 4 Distribution Examples of Poisson Distribution for Arrival Times 0.25 0.20 0.15 0.10 0.05 Probability Probability 0 1 2 3 4 5 6 7 8 9 X X = 2 Distribution
Arrival Characteristics • Size of the calling population • Finite: ex. 300 computers on campus maintained by 5 computer technicians • Infinite: ex. Cars arriving at a highway tollbooth, shoppers arriving at a supermarket • Pattern of Arrivals • Random: arrivals are independent and cannot be predicted exactly • Nonrandom: arrivals take place according to some known schedule • Behavior of the Arrivals • Balking: customers who refuse to enter the system because the line is too long • Reneging: customers who enter the queue but leave without completing their transactions • Jockeying: switching between lines
Waiting Line Characteristics • Queue Length • Limited: the length of the queue is limited by physical restrictions • ex. waiting room • Unlimited: the length of the queue is not restricted • Queue Discipline • Rule by which customers in the line are to receive service • Static: FCFS, first come first serve, FIFO, first in first out • Dynamic: Priority e.g., rush jobs at a shop are processed ahead of regular jobs
Service Facility Characteristics • Basic Queuing System Configurations • Single Channel • one service provider per phase • Multiple Channel • more than one service provider in a phase
Basic Single Queue Configurations Queue Service Facility Departures after Service Arrivals Single-Channel, Single-Phase System Queue Type 1 Service Facility Type 2 Service Facility Departures after Service Arrivals Single-Channel, Multiphase System Service Facility 1 Departures after Service Queue Service Facility 2 Arrivals Service Facility 3 Multichannel, Single-Phase System Type 1 Service Facility 1 Type2 Service Facility 1 Queue Departures after Service Arrivals Type 1 Service Facility 2 Type 2 Service Facility 2 Multichannel, Multiphase System
Multiple Queue Configurations Service Facility 1 Multiple Queue Departures after Service Service Facility 2 Arrivals Service Facility 3 Service Facility 4 Service Facility 1 7 3 12 Take a Number 11 Departures after Service Service Facility 2 5 6 10 Arrivals Service Facility 3 8 Service Facility 4 9 4
Service Facility Characteristics • Basic Queuing System Configurations • Single Channel • one service provider per phase • Multiple Channel • more than one service provider in a phase • Service Time Distribution • Constant: it takes the same amount of time to service each customer or unit • Random: service times vary across customers or units
Examples of Exponential Distribution for Service Times Probability (Service Takes Longer Than X Minutes) = e-uX for X> 0 u = Average Number Served per Minute Probability (for intervals of 1 minute) Average Service Time of 20 Minutes Average Service Time of 1 hour 0 30 60 90 120 150 180 Service Time (Minutes)
Assumptions of the Single-Channel, Single-Phase Model • Arrivals are served on a FIFO basis • Every arrival waits to be served regardless of the length of the line: that is there is no balking or reneging • Arrivals are independent of preceding arrivals, but the average number of arrivals (the arrival rate, λ) does not change over time • Arrivals are described by a Poisson probability distribution and come from an infinite or very large population • Service times also vary from one customer to the next and are independent of one another, but their average rate (μ) is known • Service times occur according to the negative exponential probability distribution • The average service rate is greater than the average arrival rate
Idea of Uncertainty • Note here that integral to queuing situations is the idea of uncertainty in • Interarrival times (arrival of customers) • Service times (service time per customer) This means that probability and statistics are needed to analyze queuing situations.
System Performance Measures • Important to measuring the performance of the system are the parameters: λ = the average number of arrivals per time period μ = the average number of people or items served per time period
System Performance Measures • Number of units in the system (customers) • Average number in system (L or Ls) • Average queue length (Lq) • Waiting Times • Average time in the system (W or Ws) • Average time in queue (Wq) • Utilization Rates • Utilization factor () • Probability of idle time (P0)
Queuing Equations Average number in system (L or Ls) Average queue length (Lq) Average time in the system (W or Ws) Average time in queue (Wq) Utilization factor () Probability of idle time (P0) L = Lq = W = Wq= = P0 = 1 - λ μ - λ λ2 μ (μ – λ) 1 μ - λ λ μ (μ – λ) λ μ λ μ
Queuing Equations Probability that the number of customers in the system is greater than k, Pn>k where n = number of units in the system Pn>k= () λ k + 1 μ
When to use what model? • Use Single-channel model, when you have • Only one service provider • Infinite source (calling population) • Random pattern of arrivals (Pois Dist) • No balking, reneging, jockeying • Random (inconstant) service times (Expo Dist) • FIFO
When to use what model? (2) • Use Multi-channel model, when you have • More than one service providers • Infinite source (calling population) • Random pattern of arrivals (Pois Dist) • No balking, reneging, jockeying • Random (inconstant) service times (Expo Dist)but both channel must perform at the same rate
When to use what model? (3) • Use Constant-service time model, when you have • Constant service times (a fixed cycle) • Infinite source (calling population) • Random pattern of arrivals (Pois Dist) • No balking, reneging, jockeying • The question will be asking about either to choose the new or the old machines.
When to use what model? (4) • Use finite population model, when you have • Finite source (calling population) • Random (inconstant) service times(Expo Dist) • Only one service providers • Random pattern of arrivals (Pois Dist) • FCFS
SUM Yes Finite pop model Finite Yes Constant ServTime Constant Model No No 1 Channel >1 Channel Single-Chn Model Multi-Chn Model