Download

1 / 42
430 likes | 628 Vues
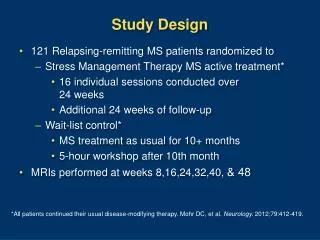
Identifying the Study Design. When reading a paper, it isn’t always clear what the study design is. Sometimes there is a combination of strategies. However, you should think about what the predominant design features are. Provides a framework for thinking about the study.

E N D
Identifying the Study Design When reading a paper, it isn’t always clear what the study design is. Sometimes there is a combination of strategies. However, you should think about what the predominant design features are. • Provides a framework for thinking about the study. • Alerts you to weaknesses in some study designs.
Identifying the Study Design Is it based on information about individuals? Or averages in populations? Correlational (Ecologic)
Identifying the Study Design 8 people with bird flu Is there just one group? Did all subjects have the disease? (Case Series) X X X X X X X X X Did they evaluate presence of disease and risk factors at the same point in time? (Cross-sectional Survey) Do you have heart disease? Are you active?
Identifying the Study Design • Two or more groups being compared? • How were they selected? Did they find people with disease [cases] and then find a comparison group without disease [controls]? (Case-Control) • Identify non-diseased people & group them by risk factor status? Then follow them longitudinally to compare incidence? (Cohort Study) X X X X X X X X Compare past exposures X X X X Compare incidence over time
X X X X X X X X Compare incidence over time Compare incidence over time In prospective cohort studies conception, design, & enrollment occur before anyone develops the outcome. Enroll non-diseased subjects; collect baseline exposure data Prospective Follow up at intervals to get accurate outcome data. Obese Lean Retrospective Identify a cohort retrospectively (e.g. tire manufacturing workers vs. desk employees. Look at what subsequently happened to them. Exposed Not Exposed
Identifying the Study Design Did the investigators assign subjects to a treatment or intervention and follow them to compare outcomes? (Clinical Trial) Aspirin X Compare incidence over time X X Placebo X
Age Category 16 - 2526 - 3536 - 45 %%% Yes 31 43 22 No 20 10 29 Unknown 49 48 49 OC Use Oral Contraceptives & Liver Cancer. Previous case reports of liver cancers in women on OCs. The authors contacted all cancer registries & collected information on all females with liver tumors. What kind of study was this? • Case series • Case-control study • Retrospective cohort • Prospective cohort • Randomized clinical trial
What kind of study is this? • Case series • Case-control • Retrospective cohort • Cross-sectional survey • Correlational (ecologic)
1830: Villerme notes that mortality varies among districts in Paris. He tried to correlate mortality with the distance of the arrondissement from the Seine River, the relationship of the streets to the prevailing winds, the arrondissement's source of water and local climatological factors such as soil type, exposure to the sun, elevation and inclination of the arrondissement.
Villerme found that mortality correlated closely with the degree of poverty in the arrondissement (estimated as the % of people exempted from tax). The findings did not spark action. poorest wealthiest
Villerme found that mortality correlated closely with the degree of poverty in the arrondissement (estimated as the % of people exempted from tax). The findings did not spark action. What kind of study was this? • Case series • Case-control • Retrospective cohort • Cross-sectional survey • Correlational (ecologic) poorest wealthiest
Investigators in Bergen, Norway sent questionnaires about respiratory health, allergies, smoking habits, and occupational respiratory exposures to a random sample of residents between the ages of 15-70. After two reminders, 2,819 responses were obtained. Of these, 1,646 reported exposure to tobacco smoke from other members of their immediate family. What kind of study was this? • Case series • Case-control • Retrospective cohort • Cross-sectional survey • Correlational (ecologic)
A study in N. Engl. J. Med. examined whether eating a Mediterranean diet had any association with mortality in Greek adults. A baseline questionnaire was used to determine how closely the subjects followed a traditional Mediterranean diet, and the group was followed for 2 years, during which they determined the cause of death among all subjects who died. What kind of study was this? • Case-control • Retrospective cohort • Prospective cohort • Randomized clinical trial
Bacteremia, Fever, and Splenomegaly Caused by a Newly Recognized Bartonella Species. Eremeeva, et al.: N Engl J Med 2007;356:2381-7.A 43-year-old American woman developed a fever after traveling in Peru for 3 weeks. She visited Lima and Nazca and then traveled to the Sacred Valley of Urubamba, followed by Cuzco and Machu Picchu, where she hiked. She received numerous insect bites. Sixteen days after returning to the US she developed fever, insomnia, muscle aches, nausea, headache, and mild cough. At the hospital she was found to have anemia and an enlarged spleen (splenomegaly). Laboratory tests determined that her blood was infected with a genus of bacterium called Bartonella. What kind of study? • Case report • Case series • Case-control • Retrospective cohort • Clinical trial • Ecologic
In 2003 a mass immunization against cholera was conducted in Beira, Mozambique. The following year there was an outbreak of El Tor Ogawa cholera in Beira. To assess the usefulness of the vaccine investigators compared the frequency of vaccination between persons with culture-confirmed cholera severe enough to have prompted them to seek treatment and age- and sex-matched neighborhood controls who did not have diarrhea. Study type? • Case series • Cross-sectional • Case-control study • Retrospective cohort • Prospective cohort • Clinical trial
Risk of kidney failure associated with the use of acetaminophen, aspirin, and nonsteroidal antiinflammatory drugs. Perneger TV, et al.People who take analgesic drugs frequently may be at increased risk of chronic kidney failure. These authors used a kidney dialysis registry to find 716 patients with kidney failure; they randomly selected 361 subjects without kidney disease from the same geographic area. They used phone interviews to estimate their cumulative past use of analgesics and compared the two groups. What kind of study? • Case series • Case-control • Retrospective cohort • Prospective cohort • Clinical trial
Adiposity as Compared with Physical Activity in Predicting Mortality among Women. Hu et al.: N Engl J Med 2004;351:2694-703. In 1976 the Nurse’s Health Study enrolled 121,700 female RNs who completed a mailed questionnaire regarding their medical history & lifestyle. The women have returned follow up information every two years. This study grouped them by exercise level & BMI and compared mortality rates among different levels of these two risk factors. Type of study? • Cases series • Case-control • Retrospective cohort • Prospective cohort • Clinical trial
Glucosamine, Chondroitin Sulfate, and the Two in Combination for Painful Knee Osteoarthritis.Clegg, et al. N Engl J Med 2006;354:795-808. Glucosamine and chondroitin sulfate are orally administered substances that have been used for years to treat joint problems in horses. Since they are relatively non-toxic there has been increasing interest in them for treating osteoarthritis, but there is controversy about their efficacy. These investigators randomly assigned 1583 patients with symptomatic knee osteoarthritis to receive 1500 mg of glucosamine daily, 1200 mg of chondroitin sulfate daily, both glucosamine and chondroitin sulfate, 200 mg of celecoxib daily, or placebo for 24 weeks. The primary outcome measure was a 20 percent decrease in knee pain from baseline to week 24. The primary outcome measure was whether the patient achieved a 20 percent decrease in pain as measured by the WOMAC pain subscale, a standardized, previously validity tool for assessing joint pain. What kind of study is this?
Type of study? These investigators randomly assigned 1583 patients with symptomatic knee osteoarthritis to receive 1500 mg of glucosamine daily, 1200 mg of chondroitin sulfate daily, both glucosamine and chondroitin sulfate, 200 mg of celecoxib daily, or placebo for 24 weeks. They compared the groups with respect to decrease in knee pain from baseline to week 24 using the WOMAC pain subscale, a standardized, previously validity tool for assessing joint pain. • Case series • Case-control • Retrospective cohort • Prospective cohort • Clinical trial
The frequency of new cases of tuberculosis in Boston during a given calendar year is… • Prevalence • Cumulative incidence • Incidence rate • None of the above
The % of deceased males who are found to have prostate cancer at autopsy? • Prevalence • Cumulative incidence • Incidence rate • None of the above
The % of people who have malaria that is resistant to treatment with chloroquine? • Prevalence • Cumulative incidence • Incidence rate • None of the above
The number of newly diagnosed brain tumors in a calendar year per 100,000 Massachusetts children? • Prevalence • Cumulative incidence • Incidence rate • None of the above
The number of previously healthy women who had a stroke during 40,000 person-years of follow up? • Prevalence • Cumulative incidence • Incidence rate • None of the above
In General: • Express prevalence and cumulative incidence as % or # per 1,000 or 10,000, etc. • Express incidence rate as # per 1,000 person-yrs or 10,000 person-years, etc. • Remember to state the time period of observation for cumulative incidence. However, for the exercises that follow and for post class quiz #2, you will need to answer with the specific numerator and denominator for some questions, to make sure that you are including and excluding the right subjects.
Study population of 1,000. Dashed line = disease present (Lung Cancer) Patients 1, 2, 3, & 4) had the disease before the study began. During the year of the study, 6 new cases occur (start of dashed lines). Among the total of 10 cases, there were 6 deaths during the year The 990 other individuals in the study did not become ill or die. 19941995 Jan Feb Mar Apr May Jun Jul Aug Sep Oct Nov Dec Jan 1<---------------------------------------------------------------------------------------------------------Alive 2<---------------------------------------Dead 3<--------------------------------------------------------------Dead 4<-----Dead 5 -----------------------------------------------------------------------------------------------------Alive 6 ----------------------------Dead 7 -------------------------------------------------------------------------Alive 8 ------------Dead 9 ------------------------------------------------------------Alive 10 ---------------------------------------Dead X X X X X X Prevalence of disease on: Jan. 1, 1994? July 1, 1994? Dec. 31, 1994?
19941995 Jan Feb Mar Apr May Jun Jul Aug Sep Oct Nov Dec Jan 1<---------------------------------------------------------------------------------------------------------Alive 2<---------------------------------------Dead 3<--------------------------------------------------------------Dead 4<-----Dead 5 -----------------------------------------------------------------------------------------------------Alive 6 ----------------------------Dead 7 -------------------------------------------------------------------------Alive 8 ------------Dead 9 ------------------------------------------------------------Alive 10 ---------------------------------------Dead Prevalence on Jan. 1, 1994? • 0/1000 • 4/1000 • 6/1000 • 4/996 • 5/996 • 6/996
19941995 Jan Feb Mar Apr May Jun Jul Aug Sep Oct Nov Dec Jan 1<---------------------------------------------------------------------------------------------------------Alive 2<---------------------------------------Dead 3<--------------------------------------------------------------Dead 4<-----Dead 5 -----------------------------------------------------------------------------------------------------Alive 6 ----------------------------Dead 7 -------------------------------------------------------------------------Alive 8 ------------Dead 9 ------------------------------------------------------------Alive 10 ---------------------------------------Dead Prevalence on July 1, 1994? • 4/997 • 4/1000 • 6/1000 • 4/996 • 5/996 • 5/997
19941995 Jan Feb Mar Apr May Jun Jul Aug Sep Oct Nov Dec Jan 1<---------------------------------------------------------------------------------------------------------Alive 2<---------------------------------------Dead 3<--------------------------------------------------------------Dead 4<-----Dead 5 -----------------------------------------------------------------------------------------------------Alive 6 ----------------------------Dead 7 -------------------------------------------------------------------------Alive 8 ------------Dead 9 ------------------------------------------------------------Alive 10 ---------------------------------------Dead Prevalence on Dec. 31, 1994? • 4/1000 • 4/996 • 4/994 • 6/1000 • 6/996 • 6/994
Study population of 1,000. Dashed line = disease present (Lung Cancer) Patients 1, 2, 3, & 4) had the disease before the study began. During the year of the study, 6 new cases occur (start of dashed lines). Among the total of 10 cases, there were 6 deaths during the year The 990 other individuals in the study did not become ill or die. 19941995 Jan Feb Mar Apr May Jun Jul Aug Sep Oct Nov Dec Jan 1<---------------------------------------------------------------------------------------------------------Alive 2<---------------------------------------Dead 3<--------------------------------------------------------------Dead 4<-----Dead 5 -----------------------------------------------------------------------------------------------------Alive 6 ----------------------------Dead 7 -------------------------------------------------------------------------Alive 8 ------------Dead 9 ------------------------------------------------------------Alive 10 ---------------------------------------Dead X X X X X X What was the cumulative incidence during 1994?
19941995 Jan Feb Mar Apr May Jun Jul Aug Sep Oct Nov Dec Jan 1<---------------------------------------------------------------------------------------------------------Alive 2<---------------------------------------Dead 3<--------------------------------------------------------------Dead 4<-----Dead 5 -----------------------------------------------------------------------------------------------------Alive 6 ----------------------------Dead 7 -------------------------------------------------------------------------Alive 8 ------------Dead 9 ------------------------------------------------------------Alive 10 ---------------------------------------Dead Cumulative incidence in 1994? • 4/1000 • 6/1000 • 10/1000 • 4/996 • 6/996 • 10/996
Study population of 1,000. Dashed line = disease present (Lung Cancer) Patients 1, 2, 3, & 4) had the disease before the study began. During the year of the study, 6 new cases occur (start of dashed lines). Among the total of 10 cases, there were 6 deaths during the year The 990 other individuals in the study did not become ill or die. 19941995 Jan Feb Mar Apr May Jun Jul Aug Sep Oct Nov Dec Jan 1<---------------------------------------------------------------------------------------------------------Alive 2<---------------------------------------Dead 3<--------------------------------------------------------------Dead 4<-----Dead 5 -----------------------------------------------------------------------------------------------------Alive 6 ----------------------------Dead 7 -------------------------------------------------------------------------Alive 8 ------------Dead 9 ------------------------------------------------------------Alive 10 ---------------------------------------Dead X X X X X X What was the population mortality rate during 1994? (Use population at beginning of year for calculation)
19941995 Jan Feb Mar Apr May Jun Jul Aug Sep Oct Nov Dec Jan 1<---------------------------------------------------------------------------------------------------------Alive 2<---------------------------------------Dead 3<--------------------------------------------------------------Dead 4<-----Dead 5 -----------------------------------------------------------------------------------------------------Alive 6 ----------------------------Dead 7 -------------------------------------------------------------------------Alive 8 ------------Dead 9 ------------------------------------------------------------Alive 10 ---------------------------------------Dead Population mortality rate in 1994? • 4/10 or 40% • 6/10 or 60% • 4/1000 or 0.4% • 6/1000 or 0.6% • 6/996 • 10/1000
Study population of 1,000. Dashed line = disease present (Lung Cancer) Patients 1, 2, 3, & 4) had the disease before the study began. During the year of the study, 6 new cases occur (start of dashed lines). Among the total of 10 cases, there were 6 deaths during the year The 990 other individuals in the study did not become ill or die. 19941995 Jan Feb Mar Apr May Jun Jul Aug Sep Oct Nov Dec Jan 1<---------------------------------------------------------------------------------------------------------Alive 2<---------------------------------------Dead 3<--------------------------------------------------------------Dead 4<-----Dead 5 -----------------------------------------------------------------------------------------------------Alive 6 ----------------------------Dead 7 -------------------------------------------------------------------------Alive 8 ------------Dead 9 ------------------------------------------------------------Alive 10 ---------------------------------------Dead X X X X X X What was the case-fatality rate during 1994?
19941995 Jan Feb Mar Apr May Jun Jul Aug Sep Oct Nov Dec Jan 1<---------------------------------------------------------------------------------------------------------Alive 2<---------------------------------------Dead 3<--------------------------------------------------------------Dead 4<-----Dead 5 -----------------------------------------------------------------------------------------------------Alive 6 ----------------------------Dead 7 -------------------------------------------------------------------------Alive 8 ------------Dead 9 ------------------------------------------------------------Alive 10 ---------------------------------------Dead Case fatality rate? • 6/10 or 60% • 6/1000 or 6% • 6/996 • 4/996 • 4/10
A new disease occurs with constant IR= 3/1000 person-yr. Estimate the cumulative incidence over 5 years. • 0.03 over 5 yrs. • 0.010 over 5 yrs. • 0.015 over 5 yrs. • 0.030 over 5 yrs.
You should be able to calculate these measures of disease frequency and measures of association using a simple hand calculator. Epi_Tools.XLS will also do them, but you need to be able to do them without Epi_Tools for the exams.
What does one measure and compare in a case-control study? • Cumulative incidence • Incidence rate • Risk of disease • Frequency of past exposures • Risk difference
In a cohort study one may measure the degree of association between an exposure and an outcome by calculating either a relative risk or an odds ratio? • True • False • I’m not sure
In a case-control study one may measure the degree of association between an exposure and an outcome by calculating either a relative risk or an odds ratio. • True • False • I don’t know.
When is an odds ratio a legitimate estimate of relative risk? • Whenever one is conducting a case-control study. • When the exposure is relatively uncommon. • When the outcome is relatively uncommon. • When the sample size is large.