Download
1 / 28
280 likes | 375 Vues
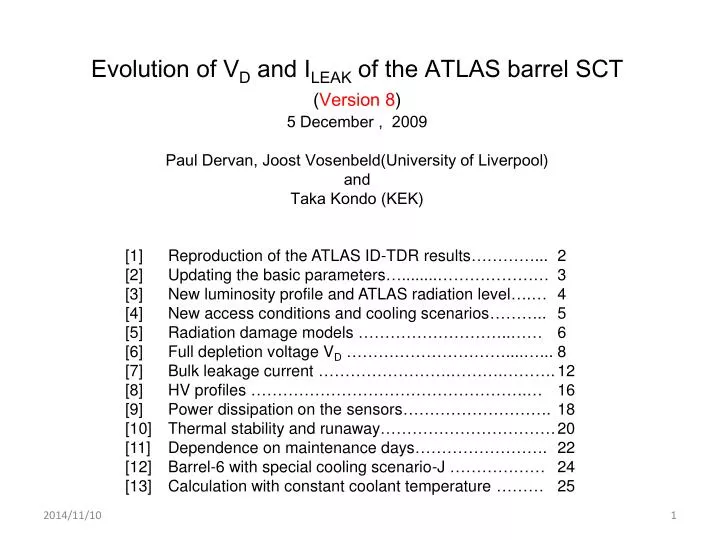
Evolution of V D and I LEAK of the ATLAS barrel SCT ( Version 8 ) 5 December , 2009 Paul Dervan, Joost Vosenbeld(University of Liverpool) and Taka Kondo (KEK). [1] Reproduction of the ATLAS ID-TDR results…………... 2 [2] Updating the basic parameters…........………………… 3

E N D
Evolution of VD and ILEAK of the ATLAS barrel SCT (Version 8) 5 December , 2009 Paul Dervan, Joost Vosenbeld(University of Liverpool) and Taka Kondo (KEK) • [1] Reproduction of the ATLAS ID-TDR results…………... 2 • [2] Updating the basic parameters…........………………… 3 • [3] New luminosity profile and ATLAS radiation level….… 4 • [4] New access conditions and cooling scenarios……….. 5 • [5] Radiation damage models ………………………..……6 • [6] Full depletion voltage VD …………………………....…... 8 • [7] Bulk leakage current …………………….……….………. 12 • [8] HV profiles …………………………………………….… 16 • [9] Power dissipation on the sensors………………………. 18 • [10] Thermal stability and runaway…………………………… 20 • [11] Dependence on maintenance days……………………. 22 • [12] Barrel-6 with special cooling scenario-J ……………… 24 • [13] Calculation with constant coolant temperature ……… 25
Assumptions of TDR fig.11-4: - Total fluence = 1.4 * 1014 neq/cm2 for 10 years - First 3 years at 1033, later 7 years at 1034 cm-2s-1 - 100 days for beam, access right after. [1] Reproduction of the ATLAS ID-TDR results ATLAS ID-TDR Figure 11-4 TDR results are more or less reproducible. Fig.1: present re-calculation
Sensor parameters must be updated since TDR: - Sensor thickness : 300 mm at TDR 285 mm [1] - Sensitive area (Barrel) : (width)80mm*768=61.440mm, (length)61.360mm - Initial depletion voltage : 34 V at TDR 65 V [2] Thus, Neff0 is set to 1.026*1012 cm-3 to reach 65V. Neutron equivalent fluence at the Barrel layers 1.3*1014 neq /cm2/730fb-1 @SCT-B3 at ID TDR new results below [3] [2] Updating the basic parameters [1] ATLAS SCT Specification [2] NIMA 578 (2007) 98–118 [3] Table5.3 of ATLAS-GEN-2005-001
[3] New luminosity profile and ATLAS radiation level Fig. 2: Integrated luminosity Fig. 3: neq-Fluenece [1] from talk given by F. Zimmermann at ATLAS Upgrade Week, Nov.9-13, 2009
[4] New access conditions and cooling scenarios Assuming possible cooling system upgrade in the end of 3rd year, various cooling scenarios are considered. (*) Scenario-J is set specially for the Barrel-6 case.
[5] Radiation damage models and parameters for VD calculation
Evolution of effective doping concentration Neff cooling scenario B, Barrel-3 Fig.4 : TDR model(2nd order) Reverse annealing (pink) takes over in later years. Fig.5 : Hamburg model (1st order) Stable acceptor (green) is dominating.
[6] Full depletion voltage VD with cooling scenario A, Barrel-3 Fig.6 : Full depletion voltage of cooling scenario A.
Cooling scenario dependence of VD Barrel-3 Fig.7 : Vd for cooling scenarios A, B, D, G and I
Differences caused by protons and neutrons Radiation damage by protons is different from that by neutrons[1]. See the right table. The plot shows the Vd evolution assuming these damage constants, while keeping the fluence values same. Note the n-eq flux ratios are [2] Fig. 8 : dependence on damage constants [1] G. Lindstrom et al., NIMA 466(2001)308 [2] Table5.3 of ATLAS-GEN-2005-001
[9] Bulk leakage current Barrel-3 for various cooling scenarios based on Harper’s model. Fig. 9 : Leakage current at the operating temperature Fig. 10 : Leakage current normalized at -7oC
Bulk leakage current: comparison with Moll’s model [1] Fig. 11: Both models on leakage current agree within +-10%. [1] Moll Logarithmic model: M. Moll et al., NIM A426(1999)87 [2] Harper model: Robert Harper’s Thesis (2001, University of Sheffield) [3] Wunstorf model: R. Wunstorf, PhD Thesis (Oct. 1992, University of Hamburg) and A Chilingarov et al., NIM A360 (1995) 432-437
[8] HV(sensor bias voltage) profiles HV-case-A : VHV set at least 100V higher than Vd (but Vmin is150V). An unique fixed HV setting for each year is assumed. HV-case-B : VHV set at the maximum voltage of 430 V. Fig.12 : Setting values of bias voltages
Voltage drop across the RHV(11.2kW) of the module SCT Barrel-3 Values of HV resisters on hybrid [1] R33, R34 = 5.1 kW, R35 = 1 kW [1] Fig. 7 of A. Abdesselam et al.,NIM A568(2006)642 Fig.13 : Voltage drop across the HV resistors on the module
[9] Power dissipation on the sensors Power = Vapply * Ileak Fig. 14 : Power density normalized at T=0oC
Total power dissipation by leak current at Barrel-3 Fig. 15 : Total power dissipation per module
[10] Thermal runaway limits Thermal simulation using FEA as well as simple model by G. Beck and G. Viehhauser (see Glasgow workshop 14/05/2009 and draft paper to be published.) • How to calculate the runaway time?“ • Pick up coolant temperature TC (say -22oC) for the next 9 years (TC=-15oC fixed for the first 3 years). • Calculate the thermal runaway critical point from the red curve (150uW/mm2). • Divide by the safety factor SF (say 2) to get the critical power density q0 (75uW/mm2). • Calculate the time reaching the corresponding q0 . SF Thermal runaway limits in bulk heat generation versus TC plane.
Coolingtemperature of B3 vs LHC year The coolant temperature TC is set at fixed value for last 9 years. Fig. 16 : runaway year as a function of TC Fig. 17 : TC versus LHC year Fig. 18 : safety factors for scenarios G,H and I Fig. 17 Fig. 18
[11] Dependence on maintenance days Duration of the annual maintenance at 20oC is changed to see the effects at the 10th year-end. Fig. 19 : Dependence of end-of-10th-year values on the maintenance days at 20oC.
Effect of shutdown with SCT warm-up days Fig. 20: One full-year shutdown is inserted at n-th year, during which the SCT is kept at -22oC except warm-up days at 20oC. The luminosity profile is kept same (except one year delay after the shutdown year).
[12] Barrel-6 with special cooling scenario-J Fig.21: Full depletion voltage Vd Fig.22: Leakage current / module Fig.23: Total bulk heat generation Fig.24: Limit of thermal runaway vs Tc Note: The maximum voltage is set at 350 V for B6.
[13] Calculation with constant coolant temperature TC • So far, the constant sensor temperature is assumed. But this is not true especially for later years. More realistic simulation is to assume the constant coolant temperature. • As pointed by G. Beck and G. Viehhauser, there are two main thermal resistances to be considered in the new simulation. Ts, QS QH (6W) RS (1.2K/W) RC (2.17K/W) TC
Tsensor evolution with constant coolant temperature scenarios Fig.25 : Sensor Temperature (TDR model) Fig.26 : Sensor Temperature (Hamburg model) Note that there are no built-in safety factors in these simulations. The results on thermal runaway points are similar to those obtained by simulation with constant sensor temperature scenarios.
Programmes and summary file can be pick up at http://atlas.kek.jp/si-soft/Vd/index.html