HEALTH INDICATORS
2.24k likes | 6.53k Vues
HEALTH INDICATORS. By Col Naseer Alam Tariq ( Retd ). Health. Health is defined as “ a state of complete physical, mental & social wellbeing, and not merely an absence of disease or infirmity ”

HEALTH INDICATORS
E N D
Presentation Transcript
HEALTH INDICATORS By Col NaseerAlam Tariq (Retd)
Health • Health is defined as “a state of complete physical, mental & social wellbeing, and not merely an absence of disease or infirmity” • This statement has been amplified to include the ability to lead a “socially and economically productive life” • Health cannot be measured in exact measurable forms • Measurement have been framed in terms of illness (or lack of health), consequences of ill-health (morbidity, mortality) & economic, occupation & domestic factors that promote ill health
Indicators of Health • Indicator also termed as Index or Variable is only an indication of a given situation or a reflection of that situation • Health Indicator is a variable, susceptible to direct measurement, that reflects the state of health of persons in a community. • Indicators help to measure the extent to which the objectives and targets of a programme are being attained. • Health Index is a numerical indication of the health of a given population derived from a specified composite formula.
Indicators WHO defines Indicators as “variables which measure change”
Uses of Indicators of Health • Measurement of the health of the community. • Description of the health of the community. • Comparison of the health of different communities. • Identification of health needs and prioritizing them. • Concurrent evaluation and terminal evaluation of health services. • Planning and allocation of health resources. • Measurement of health successes.
Characteristics of Indicators • Valid - They should actually measure what they are supposed to measure • Reliable – The answers should be the same if measured by different people in similar circumstances • Sensitive - They should be sensitive to changes in the situation concerned
Characteristics of Indicators • Specific - They should reflect changes only in the situation concerned • Feasible - They should have the ability to obtain data needed • Relevant - They should contribute to the understanding of the phenomenon of interest
Factors influencing health Indicators • Health is multidimensional • Each dimension is influenced by numerous factors • Economic, occupational, cultural, educational, social
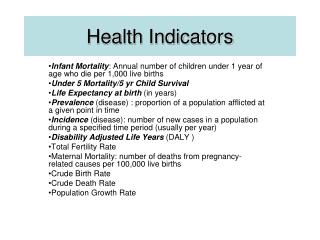
Health Indicators • Mortality indicators • Morbidity indicators • Disability rates • Nutritional status indicators • Health care delivery indicators • Utilization rates • Indicators of social and mental health • Environmental indicators • Socio-economic indicators • Health policy indicators • Indicators of quality of life • Other indicators
Mortality Indicators • Crude Death Rate • Is considered a fair indicator of the comparative health of the people. • It is defined as the number of deaths per 1000 population per year in a given community, usually the mid-year population • The usefulness is restricted because it is influenced by the age-sex composition of the population, socioeconomic and socio-cultural environment of the communities. • Current CDR is 7.2 deaths/1,000 population • CBR 27.2
Mortality Indicators • Expectation of lifeis the average number of years that will be lived by those born alive into a population if the current age specific mortality rates persist. • It is a statistical abstraction based on existing age-specific death rates. • Estimated for both sexes separately. • Good indicator of socioeconomic development • Positive health indicator of long time survival • Life expectancy at birth: Total population: 65.2 years Male: 64.3 years Female: 66.1 years
Infant mortality rate • The ratio of deaths under 1yr of age in a given year to the total number of live births in the same year, usually expressed as a rate per 1000 live births • Indicator of health status of not only infants but also whole population & socioeconomic conditions • Sensitive indicator of availability, utilization &effectiveness of health care, particularly perinatal care. • Current IMR – 67/1000live birth (69)
Child Mortality Rate • The number of deaths under 5yrs in a given year, per 1000 children in that age group at the mid-point of the year. • Correlates with inadequate MCH services, malnutrition, low immunization coverage and environmental factors • Current rate – 86/1000 • Other indicators are Perinatal mortality rate, Neonatal mortality rate, Stillbirth rate, etc. • Correlates with inadequate antenatal care and perinatal care
Mortality Indicators • Maternal Mortality Rate • Ratio of number of deaths arising during pregnancy or puerperal period per 1000 live births • Accounts for the greatest number of deaths among women of reproductive age in developing countries • Current MMR – 276/100000 live births Bal 762 Islamabad/Karachi 230-240
Mortality Indicators • Disease Specific Death Rate Mortality rate which is computed for specific diseases. E.g. TB mortality is 23 per 100000 population per year . • Proportional Mortality Rate Proportion of all deaths attributed to the specific disease E.g. Coronary heart disease causes 25 to 30 % of all deaths in developed world.
Morbidity Indicators • Morbidity Indicatorsreveal the burden of ill health in a community, but do not measure the subclinical or inapparent disease states. Incidence • The number of new events or new cases of a disease in a defined population, within a specified period of time. E.g. Incidence of TB is 168 per100000 population per year. Prevalence • The total number of all individuals who have disease at a particular time divided by population at risk of having disease at this point of time • Reflects the chronicity of the disease • E.g. Prevalence of TB (sputum+ve in population) is 249 per 100000 population
Morbidity Indicators • Notification ratesis calculated from the reporting to public authorities of certain diseases . yellow fever , poliomyelitis, cholera, plague They provide information regarding geographic clustering of infections, quality of reporting system • Attendance rates at OPDs and at health centers. • Admission, Readmission and discharge rates. • Duration of stay in hospital – reflects the virulence and resistance developed by the etiological factor • Spells of sickness or absence from work or school. - reflects economical loss to the community • Hospital data constitute a basic and primary source of information about diseases prevalent in the community.
Disability Rates • Sullivan’s Indexrefers to “expectation of life free of disability”. • Sullivan’s Index = life expectancy of the country -probable duration of bed disability and inability to perform major activities • It is considered as one of the most advanced indicators currently available. • HALE - Health Adjusted Life Expectancy. • It is based on the framework of WHO • It is based on life expectancy at birth but includes an adjustment for time spent in poor health. • It is the equivalent number of years in full health that a newborn can expect to live based on current rates of ill-health and mortality.
Disability Rates • DALYs: Disability Adjusted Life Years. • It is defined as the number of years of healthy life lost due to all causes whether from premature mortality or disability. • It is the simplest and the most commonly used measure to find the burden of illness in a defined population and the effectiveness of the interventions • Two things needed to measure DALYs are - Life table of that country, to measure the losses from premature deaths - Loss of healthy life years resulting from disability; the disability may be permanent (polio) or temp(TB, leprosy), physical / mental.
Disability Rates • Uses of DALYs • To assist in selecting health service priorities • To identify the disadvantaged groups • Targeting health interventions • Measuring the results of health interventions • Providing comparable measures for planning & evaluating programmes • To compare the health status of different countries • DALY express years of life lost to premature death and years lived with disability for the severity of the disability • One DALY is one lost year of healthy life
Disability Rates • Premature death– defined as one that occurs before the age to which a dying person could have expected to survive if he or she was a member of a standardized mode population with a life expectancy at birth equal to that of world longest surviving population e.g. Japan • QALY- Quality Adjusted Life Year. • It is the most commonly used to measure the cost effectiveness of health interventions . • It estimates the number of years of life added by a successful treatment or adjustment for quality of life.
Nutritional Status Indicators • Nutritional Status is a positive health indicator. • Newborns are measured for their i. Birth–weight ii. Length iii. Head circumference • They reflect the maternal nutrition status • Pre-school children Anthropometricmeasurements • Weight – measures acute malnutrition • Height – measures chronic malnutrition • Mid-arm circumference - measures chronic malnutrition • Growth Monitoring of children • Measuring weight-for-age, height-for-age, weight-for- height, head & chest circumference and mid-arm circumference. Adults Underweight, Obesity and Anemia are generally considered reliable nutritional indicators.
Nutritional status indicators Prevalence of low birth weight >2.5 Kg 24% Poverty Level 1$ 32.9% (44%) 2$ 60%
Health Care Delivery Indicators These indicators reflect the equity of distribution of health resources in different parts of the country and of the provision of health care • Doctor – population ratio 1 : 1222 • Doctor – Nurse ratio 2.2 : 1 • Population – bed ratio 1:1701 Population per dentist 16,854 Population per nurse 2,501 • Population per health centre 5000-10000 • Population per TBA 0.47/1000
HEALTH MANPOWER IN PAKISTAN Registered Doctors 153567 (149,201) Registered Dentists 11740 (10,958) Registered Nurses 76244 Population per doctor 1,222 Population per dentist 16,854 Population per nurse 2,501 Population per bed 1,701
Utilisation Rates • Utilisation Rates is expressed as the proportion of people in need of a service who actually receive it in a given period, usually a year • It depends on availability & accessibility of health services and the attitude of an individual towards health care system • Proportion of infants who are fully immunized • Proportion of pregnant women who receive ANC care or have institutional deliveries • Percentage of population who adopt family planning • Bed occupancy ratio, bed-turn over ratio, etc.
Indicators of Social and Mental Health • Rates of suicide, homicide, other crime, road traffic accident, juvenile delinquency, alcohol and substance abuse, domestic violence etc. • These indicators provide a guide to social action for improving the health of people. • Social and mental health of the children depend on their parents. E.g. Substance abuse in orphan children, smoking
Environmental Indicators • These reflect the quality of physical and biological environment in which diseases occur and people live. • The most important are those measuring the proportion of population having access to safe drinking water and sanitation facilities. • These indicators explains the prevalence of communicable diseases in a community • The other indicators are those measuring the pollution of air and water, radiation, noise pollution, exposure to toxic substances in food and water
Socio-economic indicators These do not directly measure health but are important in interpreting health indicators. • Per capita income $ 1372 (1258) • Level of unemployment 8% • Literacy rate 58% (57.7%) • Per capita caloric 2450 availability • Population 180.71 M (178) • Total Fertility Rate (TFR) 3.4 (3.5) • Family size 5.9 • Population increase rate 2.03% (2.05%) • Contraceptive use 30% (27%)
Health Policy Indicators • The single most important indicator of political commitment is allocation of adequate resources • The relevant indicators are • Proportion of GDP spent on health services- 0.27% (2011-12) • Proportion of GDP spent on health related activities like water supply and sanitation & housing and nutrition • Proportion of total health resources devoted primary health care
Indicators of Quality of Life • Life expectancy is no longer important • The Quality Of Life has gained its importance Physical Quality of Life Index • It consolidates Infant mortality, Life expectancy at age of 1yr and Literacy. • For each component the performance of individual country is placed on a scale of 1- 100. • The composite index is calculated by averaging the three indicators giving equal weight to each • The resulting is placed on the 0 to 100 scale. • The PQLI does not consider the GDP.
Indicators of Quality of Life Human Development Index • Life expectancy at birth • Literacy rate • Income- GDP per capita income The resulting is placed on the 0 to 1 scale
Other indicators Social indicators • Population, families, educational, earning Basic Needs indicators • Calories consumption, access to water, illiteracy, Dr per population Health for All Indicators
Summary • Health is not measured directly but using indicators • Indicator should be valid, sensitive, specific, reliable, relevant and feasible • Used in measuring, describing, comparing, identifying health needs and planning and evaluation of health services