
Cellular Respiration: Energy Production in Living Cells
This chapter explores the process of cellular respiration, the main pathway through which cells obtain energy for their functions. It covers the three stages of cellular respiration: glycolysis, citric acid cycle, and oxidative phosphorylation. The role of redox reactions and ATP production is also discussed.

Cellular Respiration: Energy Production in Living Cells
E N D
Presentation Transcript
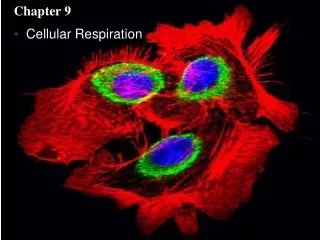
Chapter 9 • Cellular Respiration
Living cells • Require transfusions of energy from outside sources to perform their many tasks
Figure 9.1 • The giant panda obtains energy for its cells by eating plants
Light energy ECOSYSTEM Photosynthesisin chloroplasts Organicmolecules CO2 + H2O + O2 Cellular respirationin mitochondria ATP powers most cellular work Heatenergy Figure 9.2 • Energy flows into ecosystem as sunlight, leaves as heat
Catabolic Pathways and Production of ATP • Breakdown of organic molecules is exergonic
Cellular respiration • Most prevalent and efficient catabolic pathway • Consumes O2 and organic molecules e.g. glucose • Yields ATP
Redox Reactions: Oxidation and Reduction • Catabolic pathways yield energy • Due to the transfer of electrons (e-)
Oxidation • Lose e- (oxidized) • Reduction • Gain e-, (reduced)
becomes oxidized(loses electron) Na + Cl Na+ + Cl– becomes reduced(gains electron) • Example of redox reaction
Oxidation of Organic Fuel Molecules During Cellular Respiration • Glucose is oxidized and oxygen is reduced
Stepwise Energy Harvest • Glucose oxidized in a series of steps
2 e– + 2 H+ 2 e– + H+ NAD+ NADH H Dehydrogenase O O H H Reduction of NAD+ + + 2[H] C NH2 NH2 C (from food) Oxidation of NADH N N+ Nicotinamide(reduced form) Nicotinamide(oxidized form) CH2 O O O O– P O H H OH O O– HO P NH2 HO CH2 O N N H N H N O H H HO OH Figure 9.4 • Electrons f/ organic compounds • Usually first transferred to NAD+, a coenzyme
NADH (reduced form of NAD+) • Passes electrons to the e- transport chain
H2 + 1/2 O2 Explosiverelease ofheat and lightenergy (a) Uncontrolled reaction Free energy, G H2O Figure 9.5 A • Non stepwise e- transfer • Lg. release of E
e- transport chain • Passes e- in a series of steps instead of explosive reaction • Uses E from the e- transfer to form ATP
2 H + 1/2 O2 (from food via NADH) Controlled release of energy for synthesis ofATP 2 H+ + 2 e– ATP ATP Free energy, G Electron transport chain ATP 2 e– 1/2 O2 2 H+ H2O Figure 9.5 B (b) Cellular respiration
The 3 Stages of Cellular Respiration • Glycolysis • Citric acid cycle (Kreb’s cycle) • Oxidative phosphorylation
Glycolysis • Breaks down glucose into two molecules of pyruvate • Citric acid (Kreb’s)cycle • Completes breakdown of glucose
Oxidative phosphorylation • Driven by e- transport chain • Generates ATP
Glycolsis Glucose Pyruvate Mitochondrion ATP Substrate-level phosphorylation Overview of cellular respiration
Citric acid cycle Glycolsis Glucose Pyruvate Mitochondrion ATP ATP Substrate-level phosphorylation Substrate-level phosphorylation
Electrons carried via NADH Electrons carried via NADH and FADH2 Oxidativephosphorylation:electron transportandchemiosmosis Glycolsis Citric acid cycle Glucose Pyruvate Mitochondrion ATP ATP ATP Substrate-level phosphorylation Oxidative phosphorylation Substrate-level phosphorylation
Electrons carried via NADH and FADH2 Electrons carried via NADH Oxidativephosphorylation:electron transport andchemiosmosis Citric acid cycle Glycolsis Pyruvate Glucose Cytosol Mitochondrion ATP ATP ATP Substrate-level phosphorylation Oxidative phosphorylation Substrate-level phosphorylation Figure 9.6 • Overview of cellular respiration
Enzyme Enzyme ADP P Substrate + ATP Product Figure 9.7 • Glycolysis and citric acid cycle generate ATP by substrate-level phosphorylation
Glycolysis harvests E by oxidizing glucose to pyruvate • Glycolysis • Means “splitting sugar” • Glucose pyruvate • Occurs in cytoplasm
Glycolysis Oxidativephosphorylation Citricacidcycle ATP ATP ATP Energy investment phase Glucose P 2 ATP + 2 used 2 ATP Energy payoff phase formed P 4 ATP 4 ADP + 4 2 NAD+ + 4 e- + 4 H + + 2 H+ 2 NADH 2 Pyruvate + 2 H2O Glucose 2 Pyruvate + 2 H2O 4 ATP formed – 2 ATP used 2 ATP + 2 H+ 2 NADH 2 NAD+ + 4 e– + 4 H + Figure 9.8 • 2 major phases • E investment phase • E payoff phase
CH2OH Citric acid cycle H H Oxidative phosphorylation H Glycolysis H HO HO OH H OH Glucose 1 2 3 5 4 ATP Hexokinase ADP CH2OH P O H H H H OH HO H OH Glucose-6-phosphate Phosphoglucoisomerase CH2O P O CH2OH H HO HO H H HO Fructose-6-phosphate ATP Phosphofructokinase ADP CH2 O O CH2 P P O HO H OH H HO Fructose- 1, 6-bisphosphate Aldolase H O CH2 P Isomerase C O O C CHOH CH2OH O CH2 P Dihydroxyacetone phosphate Glyceraldehyde- 3-phosphate Figure 9.9 A
2 NAD+ Triose phosphate dehydrogenase P i 2 2 NADH + 2 H+ 10 7 9 8 6 2 O C O P CHOH P CH2 O 1, 3-Bisphosphoglycerate 2 ADP Phosphoglycerokinase 2 ATP O– 2 C CHOH O P CH2 3-Phosphoglycerate Phosphoglyceromutase O– 2 C O P C H O CH2OH 2-Phosphoglycerate Enolase 2 H2O O– 2 C O P C O CH2 Phosphoenolpyruvate 2 ADP Pyruvate kinase 2 ATP O– 2 C O C O CH3 Figure 9.8 B Pyruvate
Citric acid (Kreb’s) cycle completes the E-yielding oxidation of organic molecules • Takes place in matrix of mitochondrion
CYTOSOL MITOCHONDRION + H+ NAD+ NADH O– CoA S 2 C O C O C O CH3 1 3 CH3 Acetyle CoA Pyruvate CO2 Coenzyme A Transport protein Figure 9.10 • Pyruvate first converted to acetyl CoA, links cycle to glycolysis
Pyruvate(from glycolysis,2 molecules per glucose) Oxidativephosphorylation Glycolysis Citricacidcycle ATP ATP ATP CO2 CoA NADH + 3 H+ Acetyle CoA CoA CoA Citricacidcycle 2 CO2 FADH2 3 NAD+ 3 NADH FAD + 3 H+ ADP + Pi ATP Figure 9.11 • Overview of citric acid cycle
Citric acid cycle Oxidative phosphorylation Glycolysis S CoA C O CH3 Acetyl CoA CoA SH H2O O C COO– NADH 1 COO– CH2 + H+ COO– CH2 COO– NAD+ Oxaloacetate 8 C COO– HO CH2 2 CH2 HC COO– COO– COO– HO CH HO CH Malate Citrate COO– CH2 Isocitrate COO– CO2 Citric acid cycle 3 H2O 7 NAD+ COO– NADH COO– CH + H+ Fumarate CH2 CoA SH HC a-Ketoglutarate CH2 COO– C O 4 6 SH CoA COO– COO– COO– CH2 5 CH2 FADH2 CO2 CH2 CH2 NAD+ FAD C O COO– Succinate NADH CoA S P i + H+ Succinyl CoA GDP GTP ADP ATP Figure 9.12 Figure 9.12
Oxidative phosphorylation • Chemiosmosis couples e- transport to ATP synthesis • NADH and FADH2 • Donate e- to e- transport chain, which powers ATP synthesis via oxidative phosphorylation
Electron Transport Chain • e- from NADH and FADH2 lose E in steps
NADH 50 FADH2 Multiproteincomplexes I 40 FAD FMN II Fe•S Fe•S O III Cyt b 30 Fe•S Cyt c1 IV Cyt c Free energy (G) relative to O2 (kcl/mol) Cyt a Cyt a3 20 10 0 O2 2 H + + 12 Figure 9.13 H2O • At end of the chain e- passed to O2, forming water
A rotor within the membrane spins clockwise whenH+ flows past it down the H+ gradient. INTERMEMBRANE SPACE H+ H+ H+ H+ H+ H+ H+ A stator anchoredin the membraneholds the knobstationary. A rod (for “stalk”)extending into the knob alsospins, activatingcatalytic sites inthe knob. H+ Three catalytic sites in the stationary knobjoin inorganic Phosphate to ADPto make ATP. ADP + ATP P i MITOCHONDRIAL MATRIX Figure 9.14 Chemiosmosis: The Energy-Coupling Mechanism • ATP synthase • Enzyme that actually makes ATP
e- transfer pumps H+ f/ mitochondrial matrix to intermembrane space
Resulting H+ gradient • Stores E • Drives chemiosmosis • Referred to as a proton-motive force
Chemiosmosis • E-coupling mechanism, drives cellular work
Inner Mitochondrial membrane Oxidative phosphorylation. electron transport and chemiosmosis Glycolysis ATP ATP ATP H+ H+ H+ H+ Cyt c Protein complex of electron carners Intermembrane space Q IV I III ATP synthase Inner mitochondrial membrane II H2O FADH2 2 H+ + 1/2 O2 FAD+ NADH+ NAD+ ATP ADP + P i (Carrying electrons from, food) H+ Mitochondrial matrix Chemiosmosis ATP synthesis powered by the flow Of H+ back across the membrane Electron transport chain Electron transport and pumping of protons (H+), which create an H+ gradient across the membrane Figure 9.15 Oxidative phosphorylation • Chemiosmosis and the e- transport chain
An Accounting of ATP Production by Cellular Respiration • During respiration, most E flows: • Glucose NADH electron transport chain proton-motive force ATP
Electron shuttles span membrane MITOCHONDRION CYTOSOL 2 NADH or 2 FADH2 2 FADH2 2 NADH 2 NADH 6 NADH Glycolysis Oxidative phosphorylation: electron transport and chemiosmosis Citric acid cycle 2 Acetyl CoA 2 Pyruvate Glucose + 2 ATP + 2 ATP + about 32 or 34 ATP by oxidative phosphorylation, depending on which shuttle transports electrons from NADH in cytosol by substrate-level phosphorylation by substrate-level phosphorylation About 36 or 38 ATP Maximum per glucose: Figure 9.16 • 3 main processes in metabolism
~ 40% of E in a glucose molecule • Transferred to ATP during cellular respiration, making ~ 38 ATP
Fermentation; produces ATP w/o O2 • Cellular respiration • Relies on O2 to produce ATP • In the absence of O2 fermentation
Glycolysis • Produces ATP w/ or w/o oxygen, aerobic or anaerobic conditions • Couples w/ fermentation to produce ATP


