Download
1 / 26
260 likes | 276 Vues
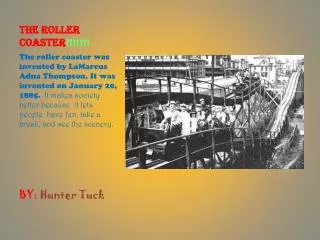
Learn how to calculate roller coaster velocities and design your own roller coaster using an Excel spreadsheet. This initial paper design project is worth 8% of your course grade. Read the project description document carefully.

E N D
Roller Coaster Design Calculations Goal Learn a method for calculating roller coaster velocities
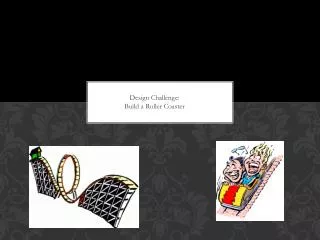
Initial Paper Design (8% of course grade) IMPORTANT - Read project description document in your course package carefully. Initial Paper Design: • Produce a sketch of your design with dimensions • Produce a comprehensive set of velocities for all segments of your design • Analysis of your calculations and design
914 Φ 254 203 457 Φ 254 914 508 813 1219 Dimensions are in mm Sample Initial Design Sketch Top View Front View Sketch by Amanda Zook, Nick Persico, Scott Stultz, Dante Henderson from ENG183 Spring ’04 (Modified for instructional purposes)
Excel Calculations • An Excel spreadsheet has been provided for you in the course website . • This spreadsheet is based on the Physics of conservation of energy as described in the labs: The sum of kinetic, potential, and energy losses must be the same at all points on the roller coaster • Three types of energy loss coefficients are included: • Frictional losses on straight track sections • Losses associated with speed (i.e. air resistance) • Losses associated with “G” forces (centripetal acceleration – changed normal forces)
Excel Spreadsheet for Calculations Set the loss coefficients to the values shown for this lecture’s examples. PE1=Potential Energy TKE = Translational KE RKE = Rotational KE E = Total PE + KE
Calculations for each segment of the Roller Coaster (without curves/loops) • For the start of the segment identify the height and put this value in h1 • For the end of the segment identify the height and put this value in h2 • The difference between s1 and s2 is the track length of the segment • Enter the velocity coming into the segment as v1 (zero if this is the start of the track) • Adjust values of v2 until the two energy values in blue are equal
For segments without curves/loops Height of start Height of finish Track length Initial velocity Final velocity- Adjust until blue E’s are equal
Let’s calculate some of the velocities for this design Segment 1: Start to loop entry No loops or curves in this segment so: h1 = .762 m h2 = .254 m v1 = 0 m/sec s1 = 0 m s2 = .683 m (determined by trigonometry, or measured)
Plugging in the values h1,h2,s1,s2,v1 NOTE: These Energy’s are not equal
Adjust v2 until blue E’s are equal Final v2 = 2.4665 m/sec MUST BE CLOSE TO EQUAL
Segment calculations with curves/loops • In addition to the h1, h2, v1, s2-s1 values there are other entries needed when centripetal acceleration is involved • In the lower portion of the spreadsheet is a section for horizontal and vertical curves/loops • Enter the diameter, Dh(horizontal) or Dv(vertical) curve/loop • Adjust values of v2 until the two energy values in blue are equal
Loops and curves Step 3: Adjust final velocity until energies are equal Step 1: Enter h1,h2,s1,s2,v1 Step2: Enter Dh or Dv
Vertical loops • For vertical loops the calculation needs to be broken into two separate segments. • First perform a calculation for the velocity from the entry of the loop to the top. • If velocity on the loop top is less than , where r is the radius of vertical loop, the ball cannot go through the loop. • Then perform a subsequent calculation for the velocity from the top of the loop to the exit
Bump Calculations • It is important to calculate the velocity of the ball when it reaches to top of the bump • If its velocity exceeds , where r is the radius of curvature of the bump, the ball will leave the track • To do this calculation break the bump into two ramps, one from the start to the top, and the other from the top to the end
In-class exercise:Calculate the velocity at the top of the loop From drawing: h1 = ? h2 = ? s1 = ? s2 = ? v1 = ? Dv = ? Plug into spreadsheet and iterate to determine: v2 final = ???
Is the velocity high enough to stay on the top of the loop (with some extra for insurance)? (gr)1/2 is 1.1156 m/s – so our 1.60 looks good Now let’s walk through the next three segments of the roller coaster design.
Loop Summary The velocity into the loop was: 2.4665 m/s The velocity out of the loop was: 2.2883 m/s Some energy was lost.
Straightaway NOTE: Small Loss
Horizontal Loop 2 ½ horizontal loops
Loss Coefficients • During the early roller coaster labs you will determine values for the loss coefficients that you can use in your initial paper design. • These do not account for all losses in a roller coaster design. Poor supports or steep drops can produce losses in addition to those calculated by this spreadsheet. • Initial values for your design are given in the spreadsheet.
r Horizontal Loop Summary • Velocity going in: 2.274 m/s • Velocity going out: 1.983 m/s • What kind of bank angles will be needed? Φin 76.5º, Φout 72.4º Do you think this will be stable? What could this team have done differently?
Roller Coaster Design Considerations One of the most difficult things in creating an interesting Roller Coaster design is controlling the velocity of the ball. If you think about the most fun roller coasters that you’ve ever been on, they’ve had changes in velocity rather than everything at one speed. Controlling the velocity of the ball makes performance less dependent on small changes between runs (and small defects in the track). This and a good support structure lead to a stable, reliable coaster design.
Initial Paper Design • The Excel spreadsheet can be used for most of the calculations required in the initial design. There are other calculations which will use the information you learned during the labs, i.e. • banking angle for horizontal curves • distance ball will land after leaving the end of the track • etc. • Read the project description document to understand all of the requirements!
Brainstorming Use the rest of this session to brainstorm ideas for your coaster with your team. Remember to include all of the required features. Remember that you need to submit calculations using the spreadsheet shown today for your entire initial design.