Examples of Pivot Chart Results
80 likes | 199 Vues
This report presents the Pivot Chart results for Ozone Season Total NOx emissions from coal units across various states, including Illinois, Indiana, Michigan, Minnesota, Ohio, Wisconsin, and Missouri/Iowa. The data reflects the emissions from coal-fired power plants (with Carbon Capture) during the ozone season of 2011, providing insights for environmental analysis and air quality assessments. The dataset aims to enhance understanding of NOx emissions trends and their implications for regulatory compliance and public health.

Examples of Pivot Chart Results
E N D
Presentation Transcript
Examples of Pivot Chart Results Version 2.0 results for Ozone Season Total Nox.
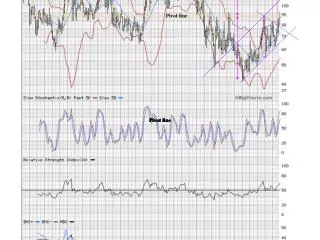
ERTAC Illinois Coal(+CC) Units, 2011 Version 2.0 Ozone Season Total NOX
ERTAC Indiana Coal(+CC) Units, 2011 Version 2.0 Ozone Season Total NOX
ERTAC Michigan Coal Units, 2011 Version 2.0 Ozone Season Total NOX
ERTAC Minnesota Coal(+CC) Units, 2011 Version 2.0 Ozone Season Total NOX
ERTAC Ohio Coal(+CC) Units, 2011 Version 2.0 Ozone Season Total NOX
ERTAC Wisconsin Coal(+CC) Units, 2011 Version 2.0 Ozone Season Total NOX
ERTAC Missouri/Iowa Coal(+CC) Units, 2011 Version 2.0 Ozone Season Total NOX