Download
1 / 20
200 likes | 223 Vues
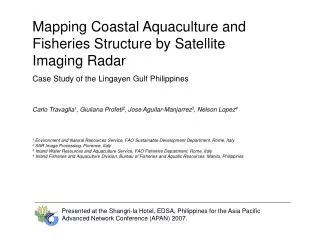
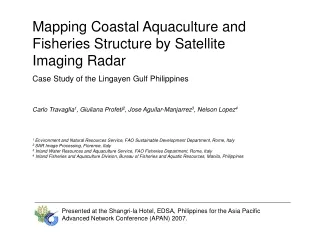
Mapping Coastal Aquaculture and Fisheries Structure by Satellite Imaging Radar. Case Study of the Lingayen Gulf Philippines. Carlo Travaglia 1 , Giuliana Profeti 2 , Jose Aguilar-Manjarrez 3 , Nelson Lopez 4.

E N D
Mapping Coastal Aquaculture and Fisheries Structure by Satellite Imaging Radar Case Study of the Lingayen Gulf Philippines Carlo Travaglia1, Giuliana Profeti2, Jose Aguilar-Manjarrez3, Nelson Lopez4 1 Environment and Natural Resources Service, FAO Sustainable Development Department, Rome, Italy2 SAR Image Processing, Florence, Italy3 Inland Water Resources and Aquaculture Service, FAO Fisheries Department, Rome, Italy 4 Inland Fisheries and Aquaculture Division, Bureau of Fisheries and Aquatic Resources, Manila, Philippines Presented at the Shangri-la Hotel, EDSA, Philippines for the Asia Pacific Advanced Network Conference (APAN) 2007.
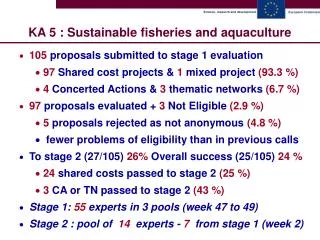
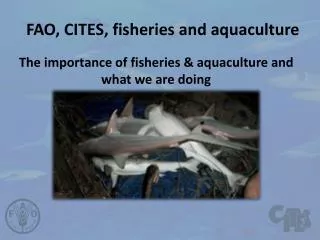
Background Philippines ranked 8th among the top fish producing countries in the world Fisheries production of 4.163 million MT (2.8%) out of the total world production of 146.27 million MT in 2005 Posted 6% growth rate from the previous year and is valued at US$2.92 billion 4.3% contribution to the GDP Philippines ranked 11th in the world for aquaculture production Aquaculture production of 1.89 million MT (4.5%) out of the global aquaculture production of 42.3 million MT 2nd largest producer of aquatic plants at 1.39 million MT or 11.58% of the total world production at 12 million MT Aquaculture sector posted the highest percentage share of 46% (1.895 million MT) and growth rate of 10.41% Aquaculture sector is valued at US$ 983.4 million
Significance of the Study Inventory and monitoring of coastal fisheries structures are essential tools for Aquaculture Development: • Planning • Regulatory Management • Economic Valuation • Policy Formulation • Environmental Protection • Revenue Generation Up-to-date information on the spatial distribution of structures to enforce development regulations, to ensure productive environment It is aimed at the general fisheries and aquaculture public, governmental administrators and planners and remote sensing and GIS specialists.
Objectives Develop and field test a methodology for the inventory and monitoring of coastal aquaculture and fisheries structures using satellite imaging radar (SAR) Evaluate the accuracy of SAR-based geospatial assessment of minute aquaculture infrastructure Identify a study area where all target structures under study are present
Description of the Test Area Lingayen Gulf is located at the northwestern coast of Luzon Island at 16 and 17 N and 119 and The gulf is a semi-circular embayment enclosing an area of 2,100km2 160 km of coastline from Cape Bolinao to Poro Point Five major rivers drain into the gulf: Bauang, Aringay, Patalang-Bued, Dagupan, and Agno. 12,000 fishers and 7,000 boats in 18 coastal municipalities CPUE stands at 1kg/fisher/day 16,000 hectares of fishponds in La Union and Pangasinan
Portion of Dagupan City Topographic Map (Sheet 7074 II) and the derived vector data. Topographic Maps 1:50,000 1977 Vectorial Maps obtained from the topographic maps
Angle between the scanning directions in the SAR data used in the study
Sea state and coastal aquaculture and fisheries structures mapping
RESULTS Classes identified in the SAR Images: Polygon Layer
RESULTS Total area covered by the classes of interest (Pangasinan Province)
RESULTS Length of Fish Traps detected in the area
Comparison of visual interpretation and in situ observations on the verification points
Field verification analysis Fishpond 95% Fish Pens 100% Fish Cages 90% Fish Traps 70%