Download
1 / 41
410 likes | 627 Vues
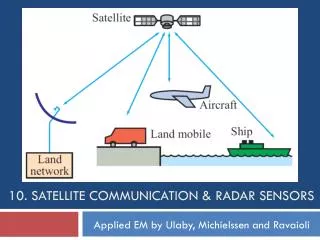
Satellite and Radar. Lecture 5 February 25, 2010. Satellites. October 4, 1957 – Russia launched Sputnik 1, the first satellite in history As a result, space science boomed in America as it led Americans to fear that the Soviets would launch missiles containing nuclear weapons.

E N D
Satellite and Radar Lecture 5 February 25, 2010
Satellites • October 4, 1957 – Russia launched Sputnik 1, the first satellite in history • As a result, space science boomed in America as it led Americans to fear that the Soviets would launch missiles containing nuclear weapons. • 1959 – Scientists at the Space Science and Engineering Center (SSEC) at UW-Madison conducted pioneering meteorological satellite research, revealing the vast benefits of meteorological satellites. http://burro.astr.cwru.edu/stu/advanced/20th_soviet_sputnik.html
Evolution Until Today • First weather satellite lasted 79 days • Now many years • Two distinct types of weather satellites • GOES - Geostationary Operational Environmental Satellites • POES - Polar Operational Environmental Satellites (also referred to as “LEO” – Low Earth Orbit) • They are defined by their orbital characteristics • There are also many other satellites in orbit, some of which are not functioning and those are referred to as “space debris”.
Geostationary Vs. Polar Orbiting http://cimss.ssec.wisc.edu/satmet/modules/sat_basics/images/orbits.jpg
GOES • GOES: Geostationary Operational Environmental Satellites • Orbit as fast as the earth spins • Maintain constant altitudes (~36,000 km, or 22,300 miles) and momentum over a single point, always over the equator
GOES • Imagery is obtained approximately every 15 minutes unless there happens to be an important meteorological phenomenon worth higher temporal resolution • Generally has poor spatial resolution-sees large fixed area and covers polar regions poorly. • But, good for viewing large scale meteorological phenomena (cyclones, hurricanes, etc.) at lower and middle latitudes
GOES GOES- EAST (GOES- 12) GOES- WEST (GOES – 11)
GOES COVERAGE http://goes.gsfc.nasa.gov/pub/goes/global_geosynch_coverage.gif
Sample Composite http://www.ssec.wisc.edu/data/comp/latest_moll.gif
POES • POES: Polar Operational Environmental Satellites • Rotates around the earth from pole to pole • Significantly closer to the Earth than geostationary satellites (879 km above the surface) • Sees the entire planet twice in a 24 hour period
POES • Lower altitude gives it a good spatial resolution: Very high resolution images of the atmosphere and Earth • Poor temporal resolution: Over any point on Earth, the satellite only captures two images per day! • Best resolution over the poles
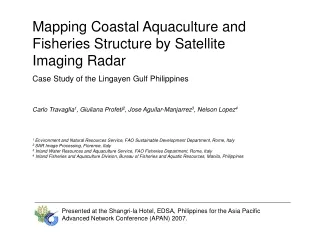
POES • More then a few in orbit currently • Two examples are TERRA and AQUA • Have different viewing instruments on them • One example is MODIS: Moderate Resolution Imaging Spectroradiometer • Acquires data in 36 spectral bands (groups of wavelengths) • As a result, MODIS can create a true color visible image, which can: • Show changes in vegetation during fall/spring • Show smoke plumes, dust plumes, etc.
Example MODIS image http://ge.ssec.wisc.edu/modis-today/images/terra/true_color/2010_02_17_048/t1.10048.USA_Composite.143.4000m.jpg
Types of Satellite Imagery • VISIBLE • Measures visible light (solar radiation, 0.6 m) which is reflected back to the satellite by cloud tops, land, and sea surfaces. • Thus, visible images can only be seen during daylight hours! • Dark areas: Regions where small amounts of visible light are reflected back to space, such as forests and oceans • Light areas: Regions where large amounts of visible light are reflected back to space, such as snow or clouds
Visible Pros/Cons • Pros: • Seeing basic cloud patterns and storm systems • Monitoring snow cover • Shows nice shadows of taller clouds (has a 3-D look to it) • Cons: • Only useful during the daylight hours • Difficult to distinguish low clouds from high clouds since all clouds have a similar albedo (reflect a similar amount of light) • Hard to distinguish snow from clouds in winter
Types of Satellite Imagery • INFRARED (IR) • Displays infrared radiation (10 to 12 m) emitted directly by cloud tops, land, or ocean surfaces • Wavelength of IR depends solely on the temperature of the object emitting the radiation • Cooler temperatures (like high cloud tops) are shown as light gray, or white tones • Warmer temperatures (low clouds, ocean/lake surfaces) are shown dark gray • Advantage: You can always see the IR satellite image
Types of Satellite Imagery • WATER VAPOR (WV) • Displays infrared radiation emitted by the water vapor (6.5 to 6.7 m) in the atmosphere • Bright, white shades represent radiation from a moist layer or cloud in the upper troposphere • Dark, grey or black shades represent radiation from the Earth or a dry layer in the middle troposphere
RADAR • What does Radar mean? • Radio Detection and Ranging • During World War II, this Radio Detection and Ranging technique was developed to track enemy ship and aircraft. However, it was soon noted that precipitation, of any kind, would obstruct this remote detection. • At first this was a problem, but the potential benefits were soon seen. This was the birth of weather Radar.
How does RADAR work? • Radar uses electromagnetic radiation to sense precipitation. • Sends out a microwave pulse (wavelength of 4-10 cm) and listens for a return echo. • If the radiation pulse hits precipitation particles, the energy is scattered in all directions • The RADAR has a “listening” period. When it detects radiation scattered back, the radiation is called an “echo.”
How does RADAR work? • The RADAR beam is typically 0.5o above the horizon • This ensures that the beam is not immediately blocked by nearby trees, buildings, etc. • It rotates in a full circle, with a radius of ~200 miles
How does RADAR work? • Time difference between transmission and return of signal = distance to the storm • The intensity of precipitation is measured by the strength of the echo, in units of decibels (just like intensity of sound waves!)
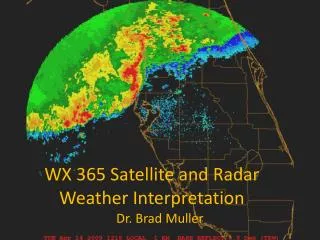
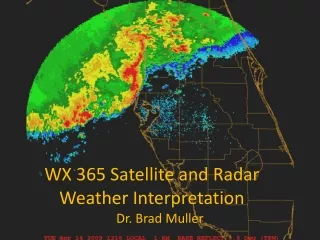
An image showing precipitation intensity is called a “reflectivity image” Intensity measured in decibels (dBZ)
Types of RADAR • Conventional Radar • Echoes are simply displayed on radar screen. • Only produces reflectivity images. • Can identify storm structure, locations of tornadoes, and even non-meteorological objects!
Circular and vertical sweeps reconstruct the precipitation type and intensity throughout the atmosphere
Good/Bad of Conventional Radar • Good for • Seeing bands/location of precip and their intensity • Hook echoes • Bow echoes • Bad for • Ground clutter, bouncing off things other than precipitation • Overestimation/Underestimation of precip • Cannot tell type of precip by radar alone (Have to use temperatures, actual observations, etc.
Doppler Radar • One of the most advanced versions of radar • Does everything a conventional radar can do, PLUS more... • In addition to conventional techniques, the Doppler Radar has a scan that operates on principle of the Doppler Effect • Usually described using sound waves • Definition: The change in the observed frequency of waves produced by the motion of the wave source
Doppler Radar in Meteorology • Measures changes in wavelength of the RADAR beam after it is scattered from a travelling object • Wavelength of the beam changes after it “strikes” the object • Thus, wind direction AND speed can be measured by RADAR
Doppler RADAR in Meteorology • This is VERY useful in detecting tornado signatures! • Doppler can measure wind speed and direction in a storm and can be viewed in a storm-relative velocity image • Red: Winds away from RADAR site, Green: Winds toward RADAR site • This is how the National Weather Service issues tornado warnings
Phased-array radar • Next generation of radar. • Can scan multiple levels at once using multiple radar beams sent out at one time. • Scanning only takes 30 secs compared to ~6 minutes for the Doppler • Gives instantaneous profile of atmosphere for winds and precipitation intensity.
Examples • Birds on radar • http://www.crh.noaa.gov/images/mkx/radar/birdanimation.gif • http://www.crh.noaa.gov/mkx/?n=using-radar