Fourier Transforms: Fundamentals and Applications
Explore the fundamentals of Fourier Transforms, including the Nyquist Frequency, Fourier series, and the Discrete Fourier Transform. Learn about the Fast Fourier Transform algorithm and its impact on signal processing. Discover the effects of changing sample rate and duration on frequency resolution. Gain insights into measuring multiple frequencies and the Discrete Fourier Transform in image processing.

Fourier Transforms: Fundamentals and Applications
E N D
Presentation Transcript
A sine wave 5*sin (24t) Amplitude = 5 Frequency = 4 Hz seconds
A sine wave signal 5*sin(24t) Amplitude = 5 Frequency = 4 Hz Sampling rate = 256 samples/second Sampling duration = 1 second seconds
The Nyquist Frequency • The Nyquist frequency is equal to one-half of the sampling frequency. • The Nyquist frequency is the highest frequency that can be measured in a signal.
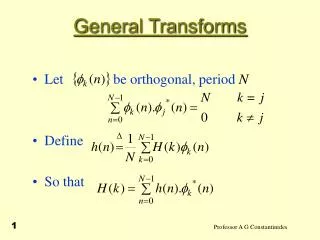
Fourier series • Periodic functions and signals may be expanded into a series of sine and cosine functions
The Fourier Transform • A transform takes one function (or signal) and turns it into another function (or signal)
The Fourier Transform • A transform takes one function (or signal) and turns it into another function (or signal) • Continuous Fourier Transform: close your eyes if you don’t like integrals
The Fourier Transform • A transform takes one function (or signal) and turns it into another function (or signal) • Continuous Fourier Transform:
The Fourier Transform • A transform takes one function (or signal) and turns it into another function (or signal) • The Discrete Fourier Transform:
Fast Fourier Transform • The Fast Fourier Transform (FFT) is a very efficient algorithm for performing a discrete Fourier transform • FFT principle first used by Gauss in 18?? • FFT algorithm published by Cooley & Tukey in 1965 • In 1969, the 2048 point analysis of a seismic trace took 13 ½ hours. Using the FFT, the same task on the same machine took 2.4 seconds!
Famous Fourier Transforms Sine wave Delta function
Famous Fourier Transforms Gaussian Gaussian
Famous Fourier Transforms Sinc function Square wave
Famous Fourier Transforms Sinc function Square wave
Famous Fourier Transforms Exponential Lorentzian
Effect of changing sample rate • Lowering the sample rate: • Reduces the Nyquist frequency, which • Reduces the maximum measurable frequency • Does not affect the frequency resolution
Effect of changing sampling duration • Reducing the sampling duration: • Lowers the frequency resolution • Does not affect the range of frequencies you can measure
L: period; u and v are the number of cycles fitting into one horizontal and vertical period, respectively of f(x,y).
Discrete Fourier Transform (DFT). • When applying the procedure to images, we must deal explicitly with the fact that an image is: • Two-dimensional • Sampled • Of finite extent • These consideration give rise to the The DFT of an NxN image can be written:
Discrete Fourier Transform • For any particular spatial frequency specified by u and v, evaluating equation 8.5 tell us how much of that particular frequency is present in the image. • There also exist an inverse Fourier Transform that convert a set of Fourier coefficients into an image.
PSD • The magnitudes correspond to the amplitudes of the basic images in our Fourier representation. • The array of magnitudes is termed the amplitude spectrum (or sometime ‘spectrum’). • The array of phases is termed the phase spectrum. • The power spectrum is simply the square of its amplitude spectrum:
FFT • The Fast Fourier Transform is one of the most important algorithms ever developed • Developed by Cooley and Tukey in mid 60s. • Is a recursive procedure that uses some cool math tricks to combine sub-problem results into the overall solution.
Periodicity assumption • The DFT assumes that an image is part of an infinitely repeated set of “tiles” in every direction. This is the same effect as “circular indexing”.
Spatial discontinuities Periodicity and Windowing • Since “tiling” an image causes “fake” discontinuities, the spectrum includes “fake” high-frequency components
Discrete Cosine Transform Real-valued
Discrete Sine Transform Most Convenient when N=2 p - 1
Hartley Transform • Alternative to Fourier • Produces N Real Numbers • Use Cosine Shifted 45o to the Right