Hidden Markov Models and Graphical Models
Hidden Markov Models and Graphical Models. CS294: Practical Machine Learning Oct. 8, 2009 Alex Simma (asimma@eecs) Based on slides by Erik Sudderth. Speech Recognition. Given an audio waveform, would like to robustly extract & recognize any spoken words Statistical models can be used to

Hidden Markov Models and Graphical Models
E N D
Presentation Transcript
Hidden Markov Modelsand Graphical Models CS294: Practical Machine Learning Oct. 8, 2009 Alex Simma (asimma@eecs) Based on slides by Erik Sudderth
Speech Recognition • Given an audio waveform, would like to robustly extract & recognize any spoken words • Statistical models can be used to • Provide greater robustness to noise • Adapt to accent of different speakers • Learn from training S. Roweis, 2004
Target Tracking • Estimate motion of targets in 3D world from indirect, potentially noisy measurements Radar-based trackingof multiple targets Visual tracking ofarticulated objects(L. Sigal et. al., 2006)
Robot Navigation: SLAM Simultaneous Localization and Mapping • As robot moves, estimate its pose & world geometry LandmarkSLAM (E. Nebot,Victoria Park) CADMap (S. Thrun,San Jose Tech Museum) EstimatedMap
Financial Forecasting • Predict future market behavior from historical data, news reports, expert opinions, … http://www.steadfastinvestor.com/
Biological Sequence Analysis • Temporal models can be adapted to exploit more general forms of sequential structure, like those arising in DNA sequences (E. Birney, 2001)
Analysis of Sequential Data • Sequential structure arises in a huge range of applications • Repeated measurements of a temporal process • Online decision making & control • Text, biological sequences, etc • Standard machine learning methods are often difficult to directly apply • Do not exploit temporal correlations • Computation & storage requirements typically scale poorly to realistic applications
Outline Introduction to Sequential Processes • Markov chains • Hidden Markov models Discrete-State HMMs • Inference: Filtering, smoothing, Viterbi, classification • Learning: EM algorithm Continuous-State HMMs • Linear state space models: Kalman filters • Nonlinear dynamical systems: Particle filters More on Graphical Models
Sequential Processes • Consider a system which can occupy one of N discrete states or categories • We are interested in stochastic systems, in which state evolution is random • Any joint distribution can be factored into a series of conditional distributions: state at time t
Markov Processes • For a Markov process, the next state depends only on the current state: • This property in turn implies that “Conditioned on the present,the past & future are independent”
State Transition Matrices • A stationary Markov chain with N states is described by an NxN transition matrix: • Constraints on valid transition matrices:
State Transition Diagrams 0.6 0.5 0.2 0.5 0.1 0.0 0.9 1 3 0.1 0.3 0.0 0.4 0.2 0.6 0.9 2 0.3 0.4 • Think of a particle randomly following an arrow at each discrete time step • Most useful when N small, and Qsparse
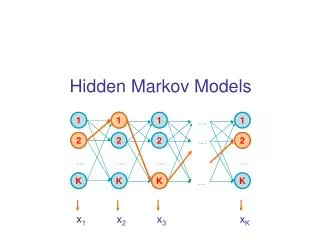
p(x3| x2) p(x2| x1) X3 X2 p(x1) X1 X6 p(x6| x2, x5) p(x4| x1) p(x5| x4) X4 X5 Graphical Models – A Quick Intro • A way of specifying conditional independences. • Directed Graphical Modes: a DAG • Nodes are random variables. • A node’s distribution depends on its parents. • Joint distribution: • A node’s value conditional on its parents is independent of other ancestors.
Markov Chains: Graphical Models 0.5 0.1 0.0 0.3 0.0 0.4 • Graph interpretation differs from state transition diagrams: 0.2 0.6 0.9 state values atparticular times Markovproperties nodes edges
Embedding Higher-Order Chains • Each new state depends on fixed-length window of preceding state values • We can represent this as a first-order model via state augmentation: (N2 augmented states)
Continuous State Processes • In many applications, it is more natural to define states in some continuous, Euclidean space: parameterized family ofstate transition densities • Examples: stock price, aircraft position, …
Hidden Markov Models • Few realistic time series directly satisfy the assumptions of Markov processes: • Motivates hidden Markov models (HMM): “Conditioned on the present,the past & future are independent” hiddenstates observedprocess
Hidden states hiddenstates observedprocess • Given , earlier observations provide no additionalinformation about the future: • Transformation of process under which dynamics take a simple, first-order form
Where do states come from? hiddenstates observedprocess • Analysis of a physical phenomenon: • Dynamical models of an aircraft or robot • Geophysical models of climate evolution • Discovered from training data: • Recorded examples of spoken English • Historic behavior of stock prices
Outline Introduction to Sequential Processes • Markov chains • Hidden Markov models Discrete-State HMMs • Inference: Filtering, smoothing, Viterbi, classification • Learning: EM algorithm Continuous-State HMMs • Linear state space models: Kalman filters • Nonlinear dynamical systems: Particle filters More on Graphical Models
Discrete State HMMs hiddenstates observedprocess • Associate each of the N hidden states with a different observation distribution: • Observation densities are typically chosen to encode domain knowledge
Discrete HMMs: Observations Discrete Observations Continuous Observations
Specifying an HMM • Observation model: • Transition model: • Initial state distribution:
Gilbert-Elliott Channel Model Hidden State: Observations: small large Time Simple model for correlated, bursty noise (Elliott, 1963)
Discrete HMMs: Inference • In many applications, we would like to infer hidden states from observations • Suppose that the cost incurred by an estimated state sequence decomposes: true state estimated state • The expected cost then depends only on the posterior marginal distributions:
Filtering & Smoothing • For online data analysis, we seek filtered state estimates given earlier observations: • In other cases, find smoothed estimates given earlier and later of observations: • Lots of other alternatives, includingfixed-lag smoothing & prediction:
Markov Chain Statistics • By definition of conditional probabilities,
Discrete HMMs: Filtering Normalizationconstant Prediction: Update: Incorporates T observations in operations
Discrete HMMs: Smoothing • The forward-backward algorithm updates filtering via a reverse-time recursion:
Optimal State Estimation • Probabilities measure the posterior confidence in the true hidden states • The posterior mode minimizes the number of incorrectly assigned states: • What about the state sequence with the highest joint probability? Bit or symbolerror rate Word or sequenceerror rate
Viterbi Algorithm • Use dynamic programming to recursively find the probability of the most likely state sequence ending with each • A reverse-time, backtracking procedure then picks the maximizing state sequence
Time Series Classification • Suppose I’d like to know which of 2 HMMs best explains an observed sequence • This classification is optimally determined by the following log-likelihood ratio: • These log-likelihoods can be computed from filtering normalization constants
Discrete HMMs: Learning I • Suppose first that the latent state sequence is available during training • The maximum likelihood estimate equals (observation distributions) • For simplicity, assume observations are Gaussian with known variance & mean
Discrete HMMs: Learning II • The ML estimate of the transition matrix is determined by normalized counts: number of times observed before • Given x, independently estimate the output distribution for each state:
Discrete HMMs: EM Algorithm • In practice, we typically don’t know the hidden states for our training sequences • The EM algorithm iteratively maximizes a lower bound on the true data likelihood: E-Step: Use current parameters to estimate state M-Step: Use soft state estimates to update parameters Applied to HMMs, equivalent to the Baum-Welch algorithm
Discrete HMMs: EM Algorithm • Due to Markov structure, EM parameter updates use local statistics, computed by the forward-backward algorithm (E-step) • The M-step then estimates observation distributions via a weighted average: • Transition matrices estimated similarly… • May encounter local minima; initialization important.
Outline Introduction to Sequential Processes • Markov chains • Hidden Markov models Discrete-State HMMs • Inference: Filtering, smoothing, Viterbi, classification • Learning: EM algorithm Continuous-State HMMs • Linear state space models: Kalman filters • Nonlinear dynamical systems: Particle filters More on Graphical Models
Linear State Space Models • States & observations jointly Gaussian: • All marginals & conditionals Gaussian • Linear transformations remain Gaussian
Simple Linear Dynamics Brownian Motion Constant Velocity Time Time
Kalman Filter • Represent Gaussians by mean & covariance: Prediction: Kalman Gain: Update:
Kalman Filtering as Regression • The posterior mean minimizes the mean squared prediction error: • The Kalman filter thus provides an optimal online regression algorithm
Constant Velocity Tracking Kalman Filter Kalman Smoother (K. Murphy, 1998)
Nonlinear State Space Models • State dynamics and measurements given by potentially complex nonlinear functions • Noise sampled from non-Gaussian distributions
Examples of Nonlinear Models Observed image is a complexfunction of the 3D pose, othernearby objects & clutter, lightingconditions, camera calibration, etc. Dynamics implicitly determinedby geophysical simulations
Nonlinear Filtering Prediction: Update:
Approximate Nonlinear Filters • Typically cannot directly represent these continuous functions, or determine a closed form for the prediction integral • A wide range of approximate nonlinear filters have thus been proposed, including • Histogram filters • Extended & unscented Kalman filters • Particle filters • …
Nonlinear Filtering Taxonomy Histogram Filter: • Evaluate on fixed discretization grid • Only feasible in low dimensions • Expensive or inaccurate Extended/Unscented Kalman Filter: • Approximate posterior as Gaussian via linearization, quadrature, … • Inaccurate for multimodal posterior distributions Particle Filter: • Dynamically evaluate states with highest probability • Monte Carlo approximation
Importance Sampling true distribution (difficult to sample from)assume may be evaluated up to normalization Z • Draw N weighted samples from proposal: • Approximate the target distribution via a weighted mixture of delta functions: • Nice asymptotic properties as proposal distribution (easy to sample from)
Particle Filters Condensation, Sequential Monte Carlo, Survival of the Fittest,… • Represent state estimates using a set of samples • Dynamics provide proposal distribution for likelihood Sample-based density estimate Weight by observation likelihood Resample & propagate by dynamics