Download
1 / 28
280 likes | 403 Vues
This document discusses simple yet effective approaches for assessing fish stocks in data-poor situations. It highlights key factors such as fecundity, recruitment, and the significance of size in management strategies. Notable indicators to combat overfishing are presented, suggesting that stock size can significantly increase with proper capture management. The paper emphasizes the importance of understanding fish biology and provides frameworks for sustainable management rules that can enhance catches while respecting ecological principles.

E N D
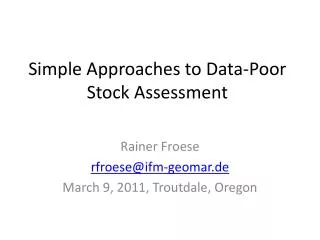
Simple Approaches to Data-Poor Stock Assessment Rainer Froese rfroese@ifm-geomar.de March 9, 2011, Troutdale, Oregon
Overview • Some background • Fecundity • Size matters • Recruitment • Options for Management • Length-only • Semelparous species • Revisiting Schaefer • If biomass is known
NO RELATIONSHIP BETWEEN FECUNDITY AND ANNUAL REPRODUCTIVE RATE IN BONY FISHRainer FROESE, Susan LUNAACTA ICHTHYOLOGICA ET PISCATORIA (2004) 34 (1): 11–20 Maximum annual reproductive rate versus mean (solid dots) and minimum (open dots) annual fecundity.
Fish and Fisheries, 2004, 5, 86–91Keep it simple: three indicators to deal with overfishingRainer Froese
Reducing catch to Fmsy is good but insufficient • Stock size may increase seven-fold if fish are caught after multiple spawning, at around 2/3 of their maximum length • Large stock size means low cost of fishing
Age-structure of North Sea Cod, with same catch but different minimum size Fmsy & Lopt Fmsy Current For a given catch, the impact on the stock is least if fish are caught at Lopt
Same catch, better age structure Stock size can increase seven-fold
The Hockey-Stick (Barrowman & Myers 2000) • Assumptions: • Constant R/S at low S • Constant R at high S
The Smooth Hockey-Stick (Froese 2008) where A = ln Rmax • Assumptions: • Practically constant R at high S • Gradually increasing R/S at lower S
Example Striped bass Morone saxatilis Parameters and accounted variance not significantly different Extrapolation VERY different
Example: 12 stocks of Atlantic cod Gadus morhua Bold line is Smooth Hockey-Stick with n = 414, α = 4.5, Rmax = 0.85 Dotted line the Ricker model with n = 414, α = 3.1, Rmax = 1.4. Data were normalized by dividing both R and S by Rmax for the respective stock.
Number of replacement spawners versus number of parents for 48 Pacific salmon populations. The fitted smooth hockey stick has a slope of 4.2 (3.6 – 5.2).
If nothing is known about the stock Management: • Get an estimate of maximum length (interviews; old photos; FishBase) • Get an estimate of length at first maturity (examine specimens; FishBase) • Set minimum length in catch and/or start of fishing season such that >90% of the specimens had a chance to reproduce before being caught • Give incentives to catch only fish with a length of 2/3 of their maximum length Justification: • Overfishing is theoretically impossible if all fish have a chance to reproduce before capture (Myers and Mertz, 1998). Impact of fishing on cohorts is minimized at about 2/3 of maximum length.
If L∞ is known Assessment • Get length at first capture and mean length in catch • Derive reference length where F ~ M from • Derive reference length where Fmsy ~ ½ M from Management • Set minimum length in catch to LF~M, if larger than length where 90% are mature, else use that length • Set target length in catch to LFmsy
Generic Harvest Control Rules for European Fisheries Rainer Froese, Trevor A. Branch, Alexander Proelß, Martin Quaas, Keith Sainsbury & Christopher Zimmermann • Rules for sustainable and profitable fisheries based on • 1) economic optimization of fisheries • 2) honoring international agreements • 3) true implementation of the precautionary principle • 4) learning from international experiences • 5) ecosystem-approach to fisheries management • 6) recognizing the biology of European fish stocks • If these rules were applied, catches could increase by 63%
North Sea Herring Once More F-based Management would not have prevented the collapse of herring.
Critique of Planned F-based Management • Fmsy is taken as target, not limit, thus violating UNFSA and the precautionary principle • Fishing at Fmsy is less profitable than at Fmey • Fishing at Fmsy results in substantially smaller stocks, violating the ecosystem approach • Fishing at Fmsy results in strongly fluctuating catches with high uncertainty for the industry • Fishing at Fmsy provides strong incentives for overcapacity • Fishing at TAC = 0.9 MSY solves these problems
Thank You Rainer Froese IFM-GEOMAR, Kiel, Germany rfroese@ifm-geomar.de