Understanding Energy and Phase Changes in Matter
60 likes | 141 Vues
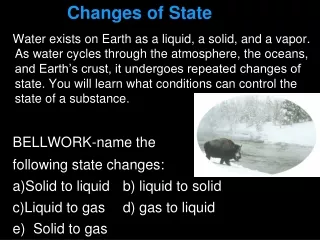
Explore how energy influences phase changes of matter, from vaporization to sublimation, and comprehend heating curves and phase diagrams with detailed explanations. Learn key terms like vaporization, deposition, and triple point.

Understanding Energy and Phase Changes in Matter
E N D
Presentation Transcript
Changes of State Objectives: • 1. Relate changes in state to changes in energy. • 2. Compare the different states of matter in terms of potential and kinetic energy • 3. Describe the major events that occur along a heating curve. • 4. Interpret a phase diagram. Key Terms: • Vaporization, condensation, evaporation, equilibrium, vapor pressure, boiling point, heat of vaporization, freezing point, heat of fusion, sublimation, deposition, heating curve, phase diagram
Energy and Phase Changes • According to the kinetic-molecular theory, a substances phase is determined by the balance of its kinetic and intermolecular forces. What this means is that you can convert matter from one phase to another by simply adding or deleting kinetic energy (heat).
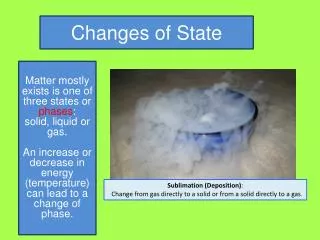
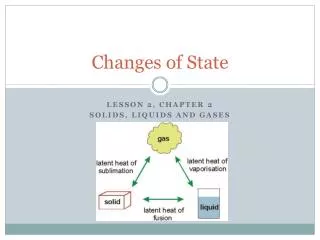
Changes in State • liquid to gas - vaporization, by process of evaporation • solid to gas - sublimation • liquid to solid - freezing • solid to liquid - melting • gas to liquid - condensation • gas to solid – deposition • triple point – where all phases are in equilibrium
Heating Curve • The heating curve is a representation of the phases of a substance compared to the temperature and internal energy of a substance. The blue lines represent the different phases of a substance while the red lines represent the heats of fusion and vaporization. • endothermic reactions move from left to right as the products increase in kinetic energy and become less organized
Heat Associated with Phase Changes • Heat of fusion (DHfus) - the amount of heat absorbed as 1 mole of a substance melts • occurs between B & C • endothermic • occurs at constant temperature • H2O(s)g H2O(l)DHfus = 6.01kJ/mol • Heat of solidification (DHsolid) - the amount of heat released as 1 mole of a substance solidifies • occurs between B & C • exothermic • occurs at constant temperature • H2O(l)g H2O(s)DHsolid = -6.01kJ/mol • Heat of vaporization (DHvap) - the amount of heat absorbed as 1 mole of a substance solidifies • occurs between D & E • endothermic • occurs at constant temperature • H2O(l)g H2O(g)DHvap = 40.7kJ/mol • Heat of condensation (DHcond) - the amount of heat released as 1 mole of a substance solidifies • occurs between B & C • exothermic • occurs at constant temperature • H2O(g)g H2O(l)DHcond = -40.7kJ/mol
Heat of Solution • Heat of solution (DHsol) - the amount of heat absorbed or released as 1 mole of a substance dissolves in 1L of solution • exothermic or endothermic • NaOH(s)g Na+(aq) + OH-(aq)DHsol = -445.1kJ/mol • NH4NO3(s)g NH4+(aq) + NO3-(aq)DHsol = 25.7kJ/mol