Download
1 / 30
300 likes | 588 Vues
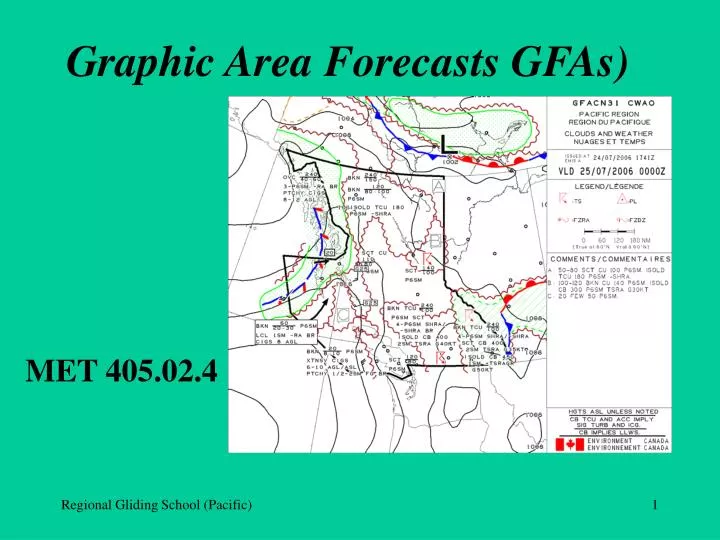
Graphic Area Forecasts GFAs) MET 405.02.4. GRAPHIC AREA FORECAST (GFA). Consists of a series of weather charts, each depicting the most probable meteorological conditions expected to occur below 400 Mb (24,000 ft.) over a given area at a specified time (the valid time);

E N D
Graphic Area Forecasts GFAs) MET 405.02.4
GRAPHIC AREA FORECAST (GFA) • Consists of a series of weather charts, each depicting the most probable meteorological conditions expected to occur below 400 Mb (24,000 ft.) over a given area at a specified time (the valid time); • The GFA is designed primarily to meet general aviation and regional air carrier requirements for pre-flight planning in Canada; and • GFAs are automatically amended by AIRMET bulletins whenever weather conditions (that are considered significant to aviation) have changed from what was being forecasted.
GRAPHIC AREA FORECAST (GFA) • Issue and Valid Times • Are issued four times daily, approximately ½ hour before the beginning of the forecast period. • The GFA is issued at approximately 2330, 0530, 1130 and 1730 UTC and is valid at 0000, 0600, 1200 and 1800 UTC respectively. • Valid for the next 12 hour period covering three separate forecast periods • Near-Term (short range forecast) • Mid-Term (a 6-hour forecast) • Long-Term (a 12-hour forecast)
GRAPHIC AREA FORECAST (GFA) • Each GFA issue will consist of a total of 6 charts 3 Clouds and Weather • Clouds and Weather (Near Term) • Clouds and Weather (Mid Term) • Clouds and Weather (Long Term) 3 Icing / Turbulence / Freezing Level • Icing / Turbulence / Freezing Level (Near Term) • Icing / Turbulence / Freezing Level (Mid Term) • Icing / Turbulence / Freezing Level (Long Term)
GRAPHIC AREA FORECAST(GFA) There are seven distinct GFA areas, covering the entire Canadian domestic airspace, over which Canada has the responsibility for the provision of air traffic control services.
GRAPHIC AREA FORECAST (GFA) • The GFA Clouds and Weather chart provides a forecast of cloud layers and/or surface-based phenomena, visibility, weather and obstructions to vision at the valid time of the particular chart. • GFAs use same codes from as used in METARs and TAFs.
GRAPHIC AREA FORECAST (GFA) • Units of Measure • speeds is expressed in knots (KT) • heights in hundreds of feet. • horizontal visibility is measured in statute miles (SM) • all times are stated in universal coordinated time (Z). • a nautical mile (NM) scale bar is included in the legend to assist in determining approximate distances on the chart • all heights are measured “above sea level” (ASL) unless otherwise noted • cloud heights given Above Ground Level (AGL) heights are indicated by CIG Exanple: ST CIGS 5 –10 AGL
Spatial Coverage Qualifiers • - the following qualifiers regarding convective and showers may be used in the GFA: Abbreviation Description Spatial Coverage ISOLD isolated less than 25% SCT scattered 25 – 50% inclusive NMRS numerous greater than 50%
Spatial Coverage Qualifiers • non-convective weather • The following qualifiers regarding restrictions to visibility, non-convective precipitation, precipitation ceilings and low stratus ceilings may be used in the GFA: Abbreviation Description Spatial Coverage LCL local less than 25% PTCHY patchy 25 – 50% inclusive XTNSV extensive greater than 50%
GRAPHIC AREA FORECAST (GFA) • Synoptic Features: The motion of synoptic features, when the speed of movement is forecast to be 5 knots or more, will be indicated by an arrow and a speed value. • for speeds less than 5 knots, the letters QS (quasi-stationary) are used. • this image translates as a low pressure centre moving eastwards at 15 knots with an associated cold front moving southeast at 10 knots
GRAPHIC AREA FORECAST (GFA) • Isobars: Isobars which are lines joining points of equal surface pressure, are included in the GFA Clouds and Weather chart at 4 millibar intervals.
GRAPHIC AREA FORECAST (GFA) • Visibility: The forecast visibility is measured in statute miles (SM). • when the visibility is expected to be greater than 6 statute miles, it is indicated as P6SM • a forecast visibility that is expected to vary between 2 and 4 statute miles with light rain showers would be indicated as 2 - 4 SM -SHRA
GRAPHICAREAFORECAST(GFA) • Weather and Obstructions to Vision: • forecast weather is always included immediately after the visibility • Obstructions to vision are only mentioned when the visibility is forecast to be 6 statute miles or less • Example: 2 - 4SM -RA BR • Only standard abbreviations are used to describe weather and precipitation with or without obstructions to vision • A dashed green border line is used to enclose areas of intermittent or showery precipitation. A solid green border lineis used to enclose areas ofcontinuous precipitation.
GFA - Clouds • the bases and tops of forecast clouds, between the surface and 24,000 ft ASL, will be indicated on the GFA Clouds and Weather chart. • the tops of convective clouds (i.e. TCU, ACC, CB) are indicated, even if they extend above 24,000ft ASL. • Cirrus clouds are not depicted on the chart. • Convective clouds such as CU, TCU, ACC, CB will always be stated, if forecasted to be present.
GFA - Clouds • A scalloped border encloses organized areas of clouds • Where the sky condition is either broken (BKN) or overcast (OVC). An organized area of broken cumulus clouds based at 2000 ft. ASL with tops at 8000 ft. ASL would be indicated as follows: In areas where organized clouds are not forecast, and the visibility is expected to be greater than 6 statute miles, a scalloped border is not used. In these areas, the sky condition is stated using the terms SKC, FEW or SCT. In the following example, unorganized scattered clouds are forecast based at 3000 ft ASL with tops at 5000 ft ASL. When multiple cloud layers are forecast, the amount of cloud at each layer is based on the amount of cloud at that level, not on the summation amount. The bases and tops of each layer are indicated.
GRAPHIC AREA FORECAST (GFA) • Areas of Obstruction to Visionv;Areas of Obstruction to vision not associated with precipitation, where visibility is 6SM or less, are enclosed by a dashed orange line area with reduced visibility 1-2 SM in smoke
GFA - Surface-based Layers • Surface-based Layers: Surface-based layers are described in abbreviated plain English • the abbreviation OBSCD (obscured) is used to describe surface-based layers. • the vertical visibility into surface-based layers is measured in hundreds of feet above ground level (AGL) • local obscured ceilings with a vertical visibility of between 300 and 500 ft AGL would be indicated as follows: • LCL OBSCD CIG 3 - 5 AGL
GFA – Surface Winds • the speed and direction of forecast surface winds, with a sustained speed of at least 20 knots, are indicated by wind barbs and an associated wind speed value. • wind gusts are indicated by the letter "G", followed by the peak gust speed in knots. • in the following example, the surface wind is forecast to be from the west (270o true) with a speed of 25 knots and a peak gust speed of 35 knots.
GFA – 12 Hour Outlook • the 12-hour Clouds and Weather chart also includes an IFR outlook for an additional 12-hour period • the IFR outlook is always general in nature, indicating the main areas where IFR weather is expected, the cause for the IFR weather and any associated weather hazards. For “meteorological purposes”, the IFR Outlook is based on the following: • VFR = CIG > 3000ft AGL and VIS > 5SM • MVFR = CIG 1000ft–3000ft AGL or VIS 3 - 5SM • IFR= CIG < 1000ft AGL or VIS < 3SM
GFA – Icing, turbulence and Freezing Level Chart thischart depicts forecast areas of icing and turbulence as well as the expected freezing level at a specific time. included on the chart are the type, intensity, bases and tops for each icing and turbulence area. surface synoptic features such as fronts and pressure centres are also shown. this chart is to be used in conjunction with the associated GFA Clouds and Weather chart issued for the same valid period.
GFA – Freezing Level • freezing level contours are indicated on the ICG/TURBC/FRLVL chart by dashed lines. • the height of the freezing level is measured above sea level and the contour lines for the freezing level will be at 2500-foot intervals, starting at the surface. • modifications to the freezing level such as above freezing layers aloft, temporary changes, etc., are explained in the Comments Box for that chart
GFA - Icing • icing is depicted whenever moderate or severe icing is forecast for the coverage area. • the bases and tops of each icing layer, measured in hundreds of feet above mean sea level (ASL), as well as the type of icing (e.g."RIME", "MXD"-mixed, "CLR"-clear) will be indicated. • areas of light icing are described in the Comments Box • if icing is expected to be present during only part of the forecast period – the time of occurrence is indicated in the Comments Box • - an area of moderate mixed icing, based at 2000 ft ASL with a top of 13000 ft ASL would be indicted as follows:
GFA - Turbulence • turbulence is depicted whenever moderate or severe turbulence is forecast for the coverage area. • The base and top of each turbulence layer is measured in hundreds of feet ASL. • If the turbulence is due to mechanical turbulence, low level wind shear, lee/mountain waves, a significant low level jet or in clear air, an abbreviation indicating the cause of the turbulence will be included (e.g. MECH, LLWS, LEE WV, LLJ or CAT). • the following example indicates an area of moderate clear air turbulence (CAT) based at 8000 ft ASL with a top at 20000 ft ASL.
Confirmation Stage and Performance Check Questions
GFA Exercise • Please Complete Exercise prior to next Met Class.
◄FORT NELSON PORT ALICE ▲ TOFINO ►
◄FORT NELSON ◄QUEEN CHARLOTTE ISLANDS ◄ VANCOUVER ISLAND
GFA Exercise • Flight____________________ Name__________________________ • Using the attached Clouds & Weather GFA answer the following Questions: • 1. What are the winds forecasted to be over the water off the central west coast of Vancouver Island? Direction ________Speed__________ • 2. What is the lowest ceiling forecasted for the Fort Nelson area? __________________ ___________________ • 3. What is the lowest ceiling and visibility being forecasted for the Tofino area? ________________________________________ • 4. What are the tops of the CB cloud in the south central BC area?___________________ • 5. What associated weather is forecasted with the CB in the south central BC?______________________________________________________________________ • 5. What is the lowest ceiling forecasted for the Port Alice area?____________________ • 6. What direction and speed is the frontal wave off the coast of central BC is moving? ___________________________________ • 7. In the Fort Nelson area would you be in flying in cloud at 9,000ft ASL?___________ • Using the attached ICG TURBC & FZLVL GFA answer the following Questions: • 1. What is the freezing Level at the top end of Vancouver Island?__________________ • 2. What is being forecasted on the south tip of Vancouver Island?__________________ • 3 . What is being forecasted off the west side of the Queen Charlotte Islands? ______________________________ • 4. What is being forecasted for the most north-western tip of BC?__________________ ______________________________