Download
1 / 18
180 likes | 349 Vues
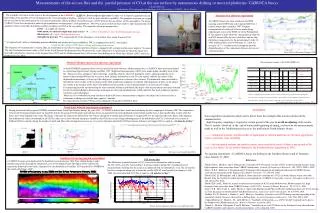
VARIABILITY OF OCEAN CO 2 PARTIAL PRESSURE AND AIR-SEA CO 2 FLUXES IN THE SUBANTARCTIC ZONE OF THE SOUTHERN OCEAN. J. Boutin (1) , L. Merlivat (1) and K. Currie (2) (1) LOCEAN, Paris, France (2) NIWA, New Zealand.

E N D
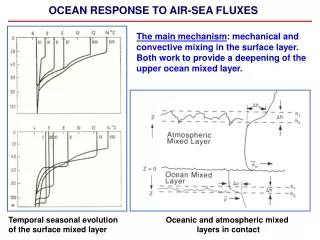
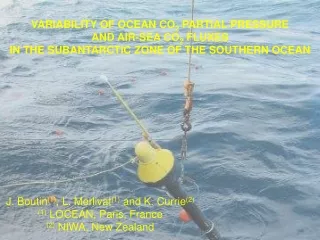
VARIABILITY OF OCEAN CO2 PARTIAL PRESSURE AND AIR-SEA CO2 FLUXES IN THE SUBANTARCTIC ZONE OF THE SOUTHERN OCEAN J. Boutin(1), L. Merlivat(1) and K. Currie(2) (1) LOCEAN, Paris, France (2) NIWA, New Zealand
Ship tracks used for building Takahashi climatology (from Li et al, 2005) + Trajectories of 8 CARIOCA buoys deployed in the Southern Ocean, Year 2001-2002 2003 2004-2005 2005 Nb CARIOCA buoys 3 2 2 1 Duration of pCO2 meas. (Months) 9 10 31 2
CARIOCA drifters • Hourly measurements (real time ARGOS transmission) • Ocean measurements at 2m depth: • pCO2 (accuracy <3matm) • SST • SSS • Fluorescence • Atm. measurementsof: • Wind speed • Atm. Pressure • Trajectory influenced by : • 15m depth currents Lifetime: up to 17 months DIC deduced from pCO2, SST and SSS assuming Alk/SSS relationship (Jabaud et al., 2004)
Air-sea CO2 flux computation K derived from satellite or CARIOCA wind speed(U) via Wanninkhof (1992) K-U relationship pCO2atm deduced from xCO2 and CARIOCA Patm 20 Sonic Anemometer on CARIOCA in 2004-2005 => 17 months of wind measurements on each buoy; precision CARIOCA / QSCAT satellite wind speeds: 1.3m/s 20 10 QSCAT wind speed (m/s) 0 0 10 20 CARIOCA wind speed (m/s)
Large flux variability dominated by DP variability (no clear seasonal cycle)
March/April 04 –June/Sept. 05 Southern buoy Northern buoy Large differences in flux and DP after July 2004: Mean fluxes: Northern buoy: -9.6 mmol m-2 day-1; Southern buoy: -5.0 mmol m-2 day-1
Comparison with Takahashi(2002) climatology (2004-2005) North-South/East-West gradient structure seen by the buoys qualitatively coherent with yearly Dp Takahashi mean in the western Pacific
Dp time and space colocation with Takahashi climatology Mean Dp along CARIOCA trajectory: NorthTaka : -17matm SouthTaka : -13matm NorthCarioca : -35matm SouthCarioca : -16matm Large scale spatial/temporal structures coherent but : -West and North Dp measured by CARIOCA lower than Takahashi : interannual variability? Oceanic trend different from atmospheric trend between 1995 and 2005? -small scale structures on CARIOCA data
Interpretation of North-South gradient South Subtropical Front pCO2 Subantarctic Front In Winter : -Southern buoy close to the SAF as defined by Belkin and Gordon (1996) -Southern buoy travels much faster than Northern buoy => Southern buoy probably in a jet on SAF High pCO2 recorded by the Southern buoy close to the SAF front
South Subtropical Front pCO2 Subantarctic Front South Subtropical Front DIC Subantarctic Front SAF signature even clearer on DIC
pCO2 -SST relationship derived from CARIOCA in Winter and from ship data south of Tasmania and New Zealand Atm. trend 1998-2005 Close to SAF Close to NZ coastal province pCO2 anticorrelated with SST close to SAF => evidence of mixing Similar slope as the ones detected from ship data south of Tasmania and New Zealand (Rangama et al., JGR, 2005)
Interpretation of CARIOCA data using ocean color SAF Chl (mg/m3) Mixing also responsible for high Chl in Spring as seen on satellite MODIS ocean color image (November month) ? Satellite Chl images, a tracer of ocean circulation
Interpretation of CARIOCA data using ocean color One month later (December 2004) a bloom developed north of SAF => strong mesoscale variability on northern buoy
fCO2 292 304 328 340 2043 2034 2052 2061 Chloro-a Chloro-a DIC December 2004, northern buoy, pCO2 and DIC decrease associated with the development of a Chl bloom 29/12 21/12 (matm) (mmol/kg)
SUMMARY -No clear seasonal cycle in the Subantarctic Zone (SAZ); variability dominated by spatial and small scale variability -Close to Subantarctic front: mixing is the dominant mechanism controlling pCO2 variability; agreement with Takahashi climatology -North/South-East/West structures similar to Takahashi climatology But lower pCO2 in the north and west part of the SAZ in the Pacific Ocean
SUMMARY -No clear seasonal cycle in the Subantarctic Zone (SAZ); variability dominated by spatial and small scale variability -Close to Subantarctic front: mixing is the dominant mechanism controlling pCO2 variability; agreement with Takahashi climatology -North/South-East/West structures similar to Takahashi climatology But lower pCO2 in the north and west part of the SAZ in the Pacific Ocean NEXT STEP How to reconcile air-sea fluxes estimated at regional scale by indirect methods (model inversions) and from surface ocean observations in the Southern Ocean? pCO2 space/time extrapolation? -Need to refine biogeochemical provinces first defined by Longhurst (1998) (northern and southern buoys under the influence of different processes although in the same Subantarctic water ring province)
SUMMARY Climatological Longhurst biogeochemical provinces subtropical NZ Subantarctic water ring -No clear seasonal cycle in the Subantarctic Zone (SAZ); variability dominated by spatial and small scale variability -Close to Subantarctic front: mixing is the dominant mechanism controlling pCO2 variability; agreement with Takahashi climatology -North/South-East/West structures similar to Takahashi climatology But lower pCO2 in the north and west part of the SAZ in the Pacific Ocean NEXT STEP How to reconcile air-sea fluxes estimated at regional scale by indirect methods (model inversions) and from surface ocean observations in the Southern Ocean? pCO2 space/time extrapolation? -Need to refine biogeochemical provinces first defined by Longhurst (1998) (northern and southern buoys under the influence of different processes although in the same Subantarctic water ring province)
SUMMARY -No clear seasonal cycle in the Subantarctic Zone (SAZ); variability dominated by spatial and small scale variability -Close to Subantarctic front: mixing is the dominant mechanism controlling pCO2 variability; agreement with Takahashi climatology -North/South-East/West structures similar to Takahashi climatology But lower pCO2 in the north and west part of the SAZ in the Pacific Ocean NEXT STEP How to reconcile air-sea fluxes estimated at regional scale by indirect methods (model inversions) and from surface ocean observations in the Southern Ocean? pCO2 space/time extrapolation? -Need to refine biogeochemical provinces first defined by Longhurst (1998) (northern and southern buoys under the influence of different processes although in the same Subantarctic water ring province) -Acquire new data sets in the Southern Atlantic Ocean: deployment of 6 CARIOCA buoys in the frame of CARBOOCEAN (EU integrated FP6 project 2005-2010).