Molecular Analysis of Tumor Tissue Sections: RNA & Gene Expression Profiles
Detailed examination of aRNA profiles, gene expression distribution, and hybridization signals in tumor and non-tumor tissues for advanced molecular analysis.

Molecular Analysis of Tumor Tissue Sections: RNA & Gene Expression Profiles
E N D
Presentation Transcript
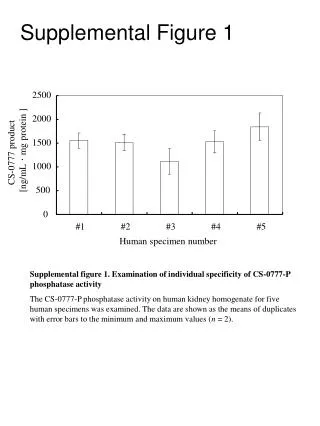
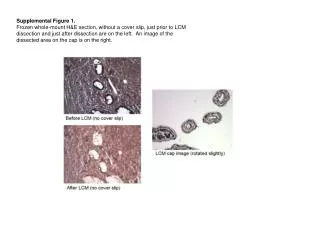
Supplemental Figure 1. Frozen whole-mount H&E section, without a cover slip, just prior to LCM dissection and just after dissection are on the left. An image of the dissected area on the cap is on the right.
A. 6kb 2kb 1 kb 500 bases 200 bases B. 6kb 2kb 1kb 500 bases 200 bases Supplemental Figure 2. aRNA analysis before and after fragmentation:examples of aRNA profiles from NE (1-2), TE (2-4), NS (5-6) and TS (7-8) samples before (A) and after (B) fragmentation.
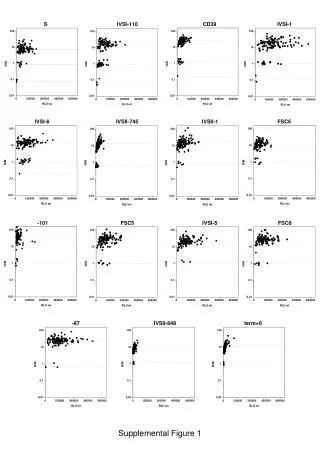
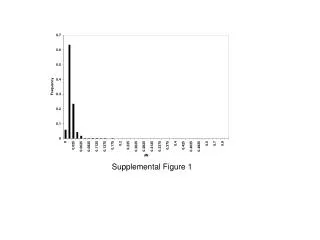
Supplemental Figure 3 a. Signal Distribution of GeneChip hybridizations from Patient 1-5 samples: Log2 transformed signal intensities for each patient sample. NE=Nontumor epithelia, TE=tumor epithelia, NS=nontumor associated stromal, TS=tumor associated stromal.
Supplemental Figure 3b. Red: Targets/genes present in both. Blue: Targets/genes absent or present in either, or marginal or present in either. Yellow: Targets/genes absent in both, or marginal in both, or absent or marginal in either.