A software infrastructure for developing performance analysis and debugging tools.
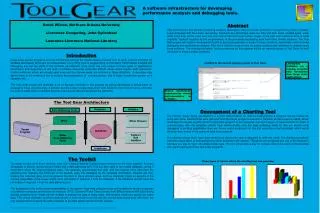
The Tool Gear Architecture. Database. Viewers. Data Gathering Tools. Other Viewers. DPCL. Database. Target Program. Other Data Gathering Tools. TgChart And CellGrid. Interfaces. A software infrastructure for developing performance analysis and debugging tools.

A software infrastructure for developing performance analysis and debugging tools.
E N D
Presentation Transcript
The Tool Gear Architecture Database Viewers Data Gathering Tools Other Viewers DPCL Database Target Program Other Data Gathering Tools TgChart And CellGrid Interfaces A software infrastructure for developing performance analysis and debugging tools. Brock Wilcox, Northern Arizona University Livermore Computing, John Gyllenhaal Lawrence Livermore National Libratory Abstract High performance and parallel computing software developers often encounter problems in programming modern parallel supercomputers that have been met before. Solutions are sometimes used one time and then never needed again, while other times they will be used over and over and enhanced though further usage. In the past such solutions were at least originally "hacked" together by the programmers, in the processes duplicating work from other similar solutions. The Tool Gear project will create a development toolkit to assist programmers in some of these situations, specifically ones involving debugging and performance analysis. Part of the toolkit is a set of tools for quickly creating user interfaces to simplify using these solutions. The charting tool which I've been working on this summer will be an important piece of Tool Gear for swift resolution of these complex problems. Introduction Large scale parallel programs, such as simulations done on the cluster supercomputers here at LLNL, present problems for software developers which are not encountered in any other type of programming environment. Performance analysis and debugging are just two parts of the software development cycle which are very unique to these types of applications. Developers and supporters of this kind of software frequently encounter difficult issues which require swift resolutions. Custom solutions, which are usually used once and then thrown away, are common in these situations. A developer may spend many hours creating a tool to analyze the performance of a single project, only to begin nearly from scratch on a separate one. The Tool Gear project will eliminate a lot of the pain involved in this process by giving developers a strong base for developing these one-time tools. It will also provide a way to scale these short term solutions into long term ones, and allow the tools to easily work on multiple projects, even across different programming platforms. CellGrid is the current primary viewer in Tool Gear. Line-by-line statistics on a running program help developers tune large scale applications. Source annotations communicate where instrumentation is available. Deveopment of a Charting Tool The primary viewer being developed is a source code browser for communicating where a program can be measured, along with some statistics that were gathered from the target program’s execution. CellGrid, as this viewer is called, allows developers to request specific points in the target program to be measured, and which types of measurements to make. It communicates with the database (which then communicates with the data gethering tools) to find out exactly what debugging or profiling possibilities there are. A very useful companion for this tool would be a charting widget, which would allow dynamic charts of the gathered data to be explored. The charting widget that I have been working on during this year is designed to fulfill this need. The charting tool allows interactive exploration of data gathered by other modules in the system. Though its not completed yet, one of the features it will have is a way to “dive” into different data sets. The tool will provide a way for complex data to be easily comprehended and used to debug and tune lare scale programs. The Toolkit Tool Gear is built out of three sections, each with a clearly defined communication interface to link them together. A binary executable is directly monitored and tested with a data gathering tool. This tool then talks to the middle database, giving it information about the target program’s state. The database accumulates this data, and can request more data from the gathering tool. Viewers, the third part of the system, query the database for the collected information. Viewers can then analyze the collected data, and then present the data in many different ways, such as statistical charts on aspects of the running executable. If the viewer wants more information it requests it from the database. If the database doesn't have the information it requests it from the data gathering tool. The modularity of the toolkit allows expandability of the system. New data collection tools can be added to monitor programs on a different computer architecture for instance. DPCL (Dynamic Probe Class Library) from IBM is native to AIX but is being actively ported to linux. Views can be created to analyze the data in many ways, and multiple views can access the same data. The central database could be replaced with a more efficient one (though the one we have works quite well now), the only requirement is keeping the same interface to the data gathering tool and the viewers. Three types of charts which the charting tool can generate. This work was performed under the auspices of the U.S. Department of Energy by University of California Lawrence Livermore National Laboratory under contract No. W-7405-Eng-48.