Download
1 / 17
170 likes | 296 Vues
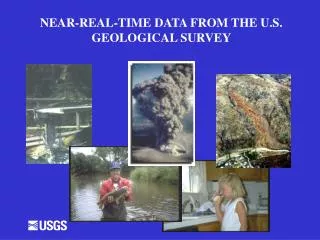
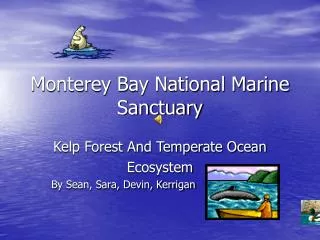
INVESTIGATING UPWELLING EVENTS USING REAL TIME DATA FROM THE MONTEREY BAY. By Lisa Adams, Becky Kapley, and Devon Lee. Summary.

E N D
INVESTIGATING UPWELLING EVENTS USING REAL TIME DATA FROM THE MONTEREY BAY By Lisa Adams, Becky Kapley, and Devon Lee
Summary • Students will investigate upwelling events in the Monterey Bay using Real Time Data. The students will compare temperature, nitrates, salinity, oxygen, and chlorophyll
Key Concepts • Coastal processes • Upwelling events • Nutrient Cycles in the ocean • Productivity • Scientists use technology to help them answer questions about the ocean
Objectives • Students will be able to: • Discover a causal relationship between nutrient availability and productivity. • Understand the importance of upwelling events. • Manipulate real time data taken using the LOBOViz
Materials • Computers with Internet access & printers • Copies of the activity
Procedure • Read the background information on EARTH’s Coastal Processes page to acquaint yourself with the effects of upwelling on productivity. • After reading the coastal processes page click on the link, “Begin upwelling case study” to familiarize yourself with the relationship between atmospheric conditions and upwelling.
Procedure 3. The two observatories from which you shall be collecting data may be found on this hyperlink. Read this page to find the exact location of the M1 and M2 moorings located in the Monterey Bay. 4. To familiarize yourself with the bathymetry of the area and the locations of these mooring, view this map.
Procedure 5. LOBOViz is a data visualization tool that allows one to investigate real time data collected by observatory sensors that are located in the Monterey Bay and surrounding areas. Go to the LOBOViz page where you will view a demonstration of LOBOViz and find quick instructions.
Procedure 6. To make your own graphs for practice, follow these instructions: • Select one graph • Specify start/end date, choose one year prior to today’s date • Under Graph 1 select the following locations: M1SURF & M2SURF. • For the X variable select Date. • For the Y variable select temperature. • Leave all other settings on the default setting. • Select send to view the graphs. • What correlation is seen when comparing water temperature and the season?
Procedure • Make a prediction as to which variable(s) would be used to determine when an upwelling event is occurring: nitrate, temperature, salinity, and oxygen µM. • To make your own graphs to determine upwelling events, follow these instructions: • Select one graph • Specify start/end date, choose one year prior to today’s date • Under Graph 1 select the following locations: M1SURF & M2SURF. • For the X variable select Date. • Select two of the following for the Y variable; nitrate, salinity, temperature, and oxygen µM. • Leave all other settings on the default setting. • Press send to view and print the graphs.
Procedure 9. On the graph, identify the month(s) of an upwelling event. If the variables that you selected do not yield adequate information, select two different variables and repeat the procedure. What factors are used to determine when an upwelling is occurring and why? 10. Make a prediction on the relationship between upwellings and productivity. Fluorimetry is the method used to determine primary productivity. What does fluorimetry measure? 11. Return to the LOBOViz site, while looking at the variables select one that would be used to indicate productivity. Create new graphs that demonstrate a clear correlation between primary productivity and the two variables that were used to determine the upwelling event from step 9.
Procedure 12. What is the correlation between upwelling and primary productivity? 13.Students will select another observing system and choose another site to determine when upwelling events occur and how it affects productivity. 14. In what ways are upwellings beneficial to the health of the ecosystem? How does this impact the economic activity of the region?
Assessment Product— Students will present their findings in a visual format such as a poster, digital presentation, website, newspaper article or brochure. Performance- Will design and interpret graphs.
Assessment • Performance— Students will build a concept map using the major concepts of this lesson.
A Special Thanks to • The Monterey Bay Aquarium Research Institute (MBARI) • The Monterey Bay Aquarium • Wetlands Educational Resource Center • Dr. Ken Johnson • Dr. Judith Kildow • Dr. George Matsumoto