Download
1 / 22
220 likes | 401 Vues
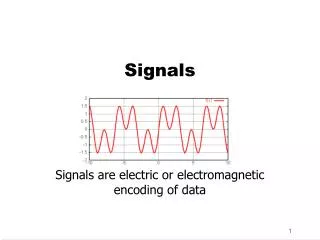
Examples of Biomedical Signals. 2nd practice Medical Informatics Biomedical Signal Processing TAMUS, Zoltán Ádám zoltanadam_tamus@yahoo.com. Examples of Biomedical Signals. Action potential Electroneurogram (ENG) Electromyogram (EMG) Electrocardiogram (ECG) Electroencephalogram (EEG)

E N D
Examples of Biomedical Signals 2nd practice Medical InformaticsBiomedical Signal Processing TAMUS, Zoltán Ádám zoltanadam_tamus@yahoo.com
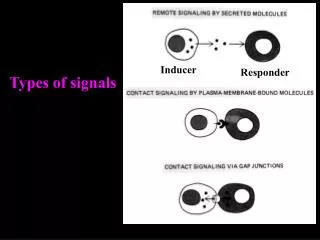
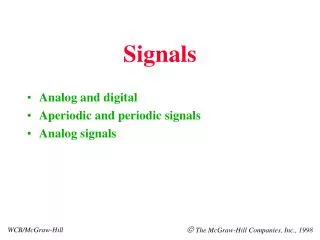
Examples of Biomedical Signals • Action potential • Electroneurogram (ENG) • Electromyogram (EMG) • Electrocardiogram (ECG) • Electroencephalogram (EEG) • Electrogastrogram (EGG) • Phonocardiogram (PCG) • Carotid Pulse (CP) • Vibromyogram (VMG) • Vibroarthogram (VAG)
The Action Potential Basic component of bioelectrical signals Caused by the flow of Na+, K+ and Cl- ions across the cell membrane
The Action Potential • Resting potential: • In their resting state, the membrane readily permit the entry of K+ and Cl- ions, but effectively block the entry of Na+ ions. • The permeability of membrane for K+ is 50-100 times that for Na+ ions. • A cell in resting state is said to be polarized. • The resting potential is in order of -60 to -100 mV
The Action Potential • Depolarization: • When a cell is excited the membrane changes its characteristics and begins to allow Na+ ions to enter the cell. • This movement of Na+ ions constitutes an ionic current, which further reduces the membrane barrier to Na+ ions. • This leads to an avalanche effect: Na+ ions rush into the cell. • The inside of the cell becomes positive. • The peak value of action potential is about 20 mV
The Action Potential • Repolarization: • Membrane depolarization also increases the permeability of membrane for K+ ions via a voltage-dependent K+ channels. • The permeability of membrane for Na+ ions decrease near the peak of depolarization. • The efflux of K+ ions from the cell makes the inside more negative thereby effecting repolarization back to the resting potential. • Duration in nerve and muscle cells ~1 ms, in heart muscle cells 150-300 ms
The Action Potential • All-or-none phenomenon • Absolute refractory period: 1 ms in nerve cells • Relative refractory period: several ms in nerve cells
Electroneurogram (ENG) The ENG is an electrical signal observed as a stimulus and the associated nerve action potential propagate over the length of nerve. ENGs may be recorded using concentric needle electrodes or Ag-AgCl electrodes at the surface of the body. In order to minimize muscle contraction strong but short stimulus is applied (100 V amplitude, 100-300 μs). ENGs have amplitudes of the order of 10 μV.
Electroneurogram (ENG) Wrist BElbow - below the elbow AElbow – above the elbow
Electroneurogram (ENG) • Typical values of propagation rate or nerve conduction velocity are: • 45-70 m/s in nerve fibres • 0.2-0.4 m/s in heart muscle • 0.03-0.05 m/s in time delay fibres between the atria and ventricles. • Neural diseases may cause a decrease in conduction velocity.
Electromyogram (EMG) Motor units Single Motor Unit Action Potential (SMUAP)
Electromyogram (EMG) Normal SMUAPs are usually biphasic or triphasic 3-15 ms in duration, 100-300 μV in amplitude, 6-30 Hz in frequency range
Electroencephalogram (EEG) The 10-20 system of electrode placement for EEG recording.
Electroencephalogram (EEG) • The commonly used terms for EEG frequency range: • Delta (0.5-4 Hz): deep sleep • Theta (4-8 Hz): beginning stages of sleep • Alpha (8-13 Hz): principal resting rhythm • Beta (>13 Hz): background activity in tense and anxious subjects
Electroencephalogram (EEG) • a: delta, b: theta, c: alpha, d: beta, e: blocking of alpha rhythm by eye opening, f: marker 50 μV, 1 sec
Electrogastrogram (EGG) The electrical activity of the stomach consists of rhythmic waves of depolarization and repolarization of its constituent smooth muscle cells. The activity originates in the mid-corpus of the stomach, with intervals of about 20 s in human. Recorded by abdomen electrodes e.g. three electrodes along the antral axis of stomach and the common reference electrode
Carotid Pulse (CP) • The CP is a pressure signal recorded over the carotid artery. • Parts of CP: • P (percussion wave): ejection of blood from the left ventricle • T (tidal wave): reflected pulse from the upper body • D (dicrotic notch): closure of the aortic valve • DW (dicrotic wave): reflected pulse from the lower body
Vibromyogram (VMG) Direct mechanical manifestation of contraction of a skeletal muscle. Accompanies the EMG Recorded by contact microphones or accelerometers placed on the muscle surface.
Vibroarthogram (VAG) The VAG is the vibration signal recorded from a joint during movement (articulation) of the joint. Normal joint surfaces are smooth and produce little or no sound. Joint affected by osteoarthiritis and other degenerative diseases may have suffered cartilage loss and produce grinding sounds. The VAG is complex signal and difficult to analyze.