Download

1 / 42
420 likes | 594 Vues
Terrain Analysis Tools for Routing Flow and Calculating Upslope Contributing Areas. John P. Wilson Terrain Analysis for Water Resources Applications Symposium 2002. Today’s Topics. Guiding principles Proposed flow routing algorithms Flow routing methods implemented in TAPES-G

E N D
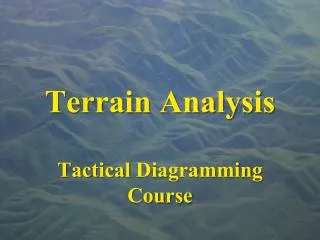
Terrain Analysis Tools for Routing Flow and Calculating Upslope Contributing Areas John P. Wilson Terrain Analysis for Water Resources Applications Symposium 2002
Today’s Topics • Guiding principles • Proposed flow routing algorithms • Flow routing methods implemented in TAPES-G • Sensitivity of computed topographic attributes to choice of flow routing method • Key decisions, problems, and challenges
Scales / Processes / Regimes Cloud cover and CO2 levels control primary energy inputs to climate and weather patterns Prevailing weather systems control long-term mean conditions; elevation-driven lapse rates control monthly climate; and geological substrate exerts control on soil chemistry Surface morphology controls catchment hydrology; slope, aspect, horizon, and topographic shading control surface insolation Vegetation canopy controls light, heat, and water for understory plants; vegetation structure and plant physiognomy controls nutrient use Soil microorganisms control nutrient recycling Global Meso Topo Micro Nano
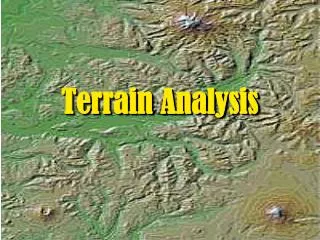
Land Surface Shape Courtesy Graeme Aggett 2001
Terrain Shape … • Terrain shape / drainage structure important at toposcale • Locally adaptive gridding procedures work well with contour and stream line data • Need filtering / interpolation methods that respect surface structure for remotely sensed elevation sources • Choose resolution based on data sources / quality and not the application at hand
Flow Direction / Catchment Area • Flow direction shows path of water flow … • Upslope contributing area A is area of land upslope of a length of contour l • Specific catchment area is A/l
Proposed Flow Routing Algorithms • Vary depending on granularity with which aspect is computed and whether single or multiple flow paths are allowed • Single flow direction algorithms • D8 (O’Callaghan and Mark 1984) • Rho4 / Rho8 (Fairfield and Leymarie 1991) • Aspect-driven (Lea 1992)
… Flow Routing Algorithms (2) • Multiple flow direction algorithms • FD8 (Quinn et al. 1991) • FMFD (Freeman 1991; Holmgren 1994) • DEMON (Costa-Cabral and Burges 1994) • R.flow (Mitasova and Hofierka 1993; Mitasova et al. 1995, 1996) • D∞ (Tarboton 1997) • Form-based method (Pilesjo et al. 1998) Courtesy Qiming Zhou and Xuejun Liu 2002
TAPES-G Algorithms • Single-flow-direction D8 method • Randomized single-flow-direction Rho8 method • Multiple-flow-direction FD8 and FRho8 methods • DEMON stream-tube method
TAPES-G Inputs • Square-grid DEM • Important decisions about extent of study area and how to handle edge effects, spurious sinks or pits, etc. • Interested in hydrologic connectivity of topographic surface
Aspect / Primary Flow Direction? • Shows aspect computed using finite difference method • Poor choice of scale bar?
Primary Flow Direction (FLOWD) • Approximate surrogate for aspect since it identifies direction to the nearest neighbor with maximum gradient FLOWD = 2j - 1 where j = arg max i = 1,8 • The approximate aspect corresponding to this flow direction is ΨD8 = 45j
D8 SFD Algorithm • Does well in valleys • Produces many parallel flow lines and problems near catchment boundary • Cannot model flow divergence in ridge areas
D8 SFD Algorithm • Diagram shows detail near catchment boundary • Dark cells not located on boundary – due to subtle change in aspect as it swifts from south to southeast
Rho8 SFD Algorithm • Breaks up parallel flow paths / produces mean flow direction equal to aspect • More cells with no upslope connections • Produces unique result each time
FD8 MFD Algorithm • Distributes flow on hillslopes to each downslope neighbor on a slope-weighted basis • Specify cross-grading threshold to disable this feature in valleys
DEMON Algorithm • Flow generated at each source pixel and routed down a stream tube until edge of DEM or a pit is encountered • Stream tubes constructed from points of intersections of a line drawn in gradient direction and a grid cell edge
DEMON Stream-Tube Algorithm • Three variants used in TAPES-G – related to … • Choice of DEM • Use of grid centroids in place of vertices • Definition of aspect
Upslope Contributing Area • Computed with contour-based stream tubes in northern part of catchment …
Contour DEM Elements • Set of elements formed by contours and flow lines • Proceeding uphill, flow lines are terminated (A) and added (B, C) to maintain even spacing • Lines are constructed using either a minimum distance (BD) or orthogonal (CE) criterion
Specific Catchment Area • 105 km2 Squaw Creek catchment in Gallatin National Forest, Montana • Results derived from 30 m DEMS for 3 USGS 1:24,000 scale map quadrangles
Key Decisions and Challenges • Methods can be distinguished based on equation used to estimate aspect and whether or not they permit flow to two or more downslope cells • Most of the results produced thus far relate to coarse resolution DEM products • Sensitivity analysis results are difficult to extrapolate to new study sites
New Data Sources • Several presentations about SAR and LIDAR technology data at this conference • Must develop and/or find methods for filtering and interpolation that respect surface structure for these remotely sensed elevation sources
Interpolation Results TIN IDW Surf.tps (GRASS) Thin plate spline TOPOGRID Courtesy Graeme Aggett 2001
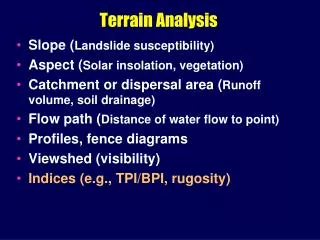
Topographic Attributes • Elevation • Slope • Profile curvature • Plan curvature • Distance from ridge lines • Incident solar radiation • Topographic wetness index • Sediment transport capacity index
Fuzzy Classification • Split study area into three equal parts • Took stratified random sample and extracted topographic attributes • Performed several fuzzy k-means classifications • Calculated confusion index and F and H parameters and generated fuzzy and crisp landform class maps
Final Landform Classes • Valley bottoms • Main drainage lines • Lower slopes • Steep, shaded north-facing slopes • Narrow ridge lines • Steep, south-facing, drier upper slopes and broad ridges
Closing Comments • Several graduate students working on new data sources and fuzzy classification of landscapes • One is looking at performance of five flow routing algorithms in different landform classes with 5 m SAR DEM for example • May be able to answer one or two questions if there is time available