Download
1 / 47
470 likes | 511 Vues
This comprehensive training course covers the basics of Project Cycle Management, emphasizing the use of the Logframe Matrix and development of verifiable indicators. Participants will learn how to set clear objectives, identify sources of verification, and assess assumptions to ensure effective project evaluation. The training will focus on defining indicators, sources of verification, and their role in monitoring project progress. Participants will gain practical skills in setting up a system of indicators, collecting data, and analyzing results to achieve project success.

E N D
Project Cycle Management Basic PCM Training Course
The Logframe Matrix Project Description Verifiable Indicators Sources of Verification Assumptions Overall objective Project purpose Outputs Activities means costs Pre-conditions
Levels of the project description Overall objective • Relate to the wider sectoral or national objective, to which the project will contribute; Project purpose • The sustainable flow of benefits to the project’s target groups(s); Results • The goods and services delivered by the project; Activities • What the project does to produce the results (work program/tasks).
Indicators – What are they? • An indicator is a unit of measurement • E.g. kilometres of road, population numbers • An indicator tells us something about changes in a system • e.g. Financial indicators (stock markets up / down) • An indicator helps to quantify and simplify phenomena and helps us understand complex realities • E.g. Blue Flag for bathing water quality • An Indicator is not a Target!
The Objectively Verifiable Indicators (OVI) should be: Specific : including (where appropriate) clear targets; Measurable: in terms of quality and/or quantity; Available : at an acceptable cost; Relevant : to what they are supposed to measure (horizontal logic); Timely : produced in due time to be useful for project management. Characteristics of a good indicator
Sources of Verification (I) • The logical framework requires that one spells out how the indicators will be collected : • How/through which methods ? • By whom? • When/how often? Admin records Activities, resources and costs required to collect this information must be included in the project design Project managers should focus on verifying the delivery of results and their contribution to the purpose
Sources of Verification (II) Specialised surveys Cost Interviews with beneficiaries Adapted available statistics Available statistics Management reports Administrative reports Complexity
Describing Indicators • Indicators help to define: • Q Quality • Q Quantity • T Time • P Place
Defining an Objective: • Define objective: Educational status improved • Specify quality: Number of graduates completing degree courses increased • Specify quantity: Number of graduates completing degree courses increased from 500 to 1000 • Specify timeframe: Number of graduates completing degree courses increased from 500 to 1000 per year by the year 2007 • Specify Place: Number of graduates from Tartu Technical College completing degree courses increased from 500 to 1000 per year by the year 2007
Indicators, Projects and Programmes Global objectives are expressed in terms of impacts (e.g. a reduction in unemployment among the previously long term unemployed). Specific objectives are expressed in terms of results (e.g. the improvement, through training, of the employability of the long term unemployed); Operational objectives are expressed in terms of outputs (e.g. the provision of training courses to the long-term unemployed);
Note! • Indicators require good data, based on monitoring • Indicators are not targets! • Indicators can help to reduce uncertainty, but not eliminate it • Sets of indicators evolve over time • Sets of indicators are seldom, if ever, complete • Indicators can help influence behaviour. • Indicators must be able to take into account different locations, people, cultures and institutions • Different people from different places have different values
Criteria for Indicator Selection • For Policy relevance and utility for users • an indicator : • • should provide a representative picture • should be simple, easy to interpret and able to show trends over time; • must be responsive to changes • can provide a basis for international, regional comparisons; • must have a comparative threshold or reference value/Baseline against to assess the significance of the values.
Criteria for Indicator Selection • Analytical soundness • be theoretically well founded in technical and scientific terms; • be based on international standards and international consensus about its validity; • lend itself to being linked to economic models, forecasting and information systems. • Measurability • The data required to support the indicator should be: • readily available or made available at a reasonable cost/benefit ratio; • adequately documented and of known quality; • updated at regular intervals in accordance with reliable procedures.
Setting up a system of indicators • Baseline • Context Indicators • Monitoring Indicators Example: Scottish Executive ESF & ERDF Indicators
Indicators for ESF Projects - Scotland • Project Level Core Indicators • Number of beneficiaries of ESF assistance, show separately: • % of persons aged 16-24 receiving assistance • % of persons in this group unemployed for less than 6 months before assistance began • % of persons aged 25 and over receiving assistance • % of this group unemployed for less than 12 months before assistance began • % of those who complete their course • % of those leaving ESF funded training for positive outcomes, split by end destination: • into full or part-time employment • self employment • full time FE/training/other Government training schemes • % of leavers who gain a qualification or part qualification • % of beneficiaries who receive assistance specifically geared towards self employment • Number of existing companies given direct assistance from ESF • % of parents with children under 5, in employment 6 months after ESF assistance
Indicators for ERDF projects - Scotland • Projects in Scotland; Project Level Core Indicators • Indicator Name • Assistance to Business • Number of businesses assisted and instances of assistance, showing SMEs separately. • Increase in sales in assisted businesses. • Hectares of serviced land created or enhanced, split by greenfield / brownfield sites. • M2 of business space created or enhanced - occupied after 18 mths/3 yrs. • Private sector finance levered in by new assisted projects. • Value of investment in R&D by assisted SMEs. • Number of patents/intellectual property rights registrations by assisted SMEs. • Number of organisations taking up e-commerce trading. • Increase in visitor numbers. • Number and M2 of new training/learning facilities constructed or upgraded.
Indicators ERDF Projects - Scotland • Jobs and Employment • Gross new jobs created. • Number of jobless people securing employment. • Number of young people under 25 years of age placed in employment. • Number of gross jobs created through self-employment. • Gross number of jobs safeguarded. • Social Inclusion and Equal Opportunities • Gross number of assisted organisations introducing active equal opportunity policies. • Number of childcare facilities and places created. • Number of organisations achieving recognised quality awards. • Environment • K/W of new renewable energy infrastructure installed. • Number of SMEs undertaking environmental management. • Number of strategic environmental/forestry partnerships funded. • Hectares of natural habitat under management. • Increase in volume of waste recycled or reused.
Indicators Progress Chart Scottish Executive Environment Group Indicators of Sustainable Development for Scotland: Progress Report 2004 February 2004 Paper 2004/3
Headline Indicators National Assessment UK Regional Quality of Life Counts – 2002
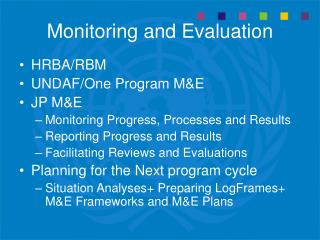
Some Principles of M&E • Keep the needs of the information user clearly in mind. Who is this information for? How will they use it? • More information is not better information • A balance of quantitative and qualitative information is usually best • Collecting and using information requires time and resources – allow for this in the project design
A regular reporting mechanism, preparing and submitting analytical assessment to project management and other involved parties Definition of Monitoring
Monitoring of Projects & Programmes Monitoring needs a formal structure which sets out: What is to be monitored? How will it be done? Who will do it? When will it be carried out? Where and how is information to be recorded? Baselines data and project Indicators
Why Monitor ? • To keep track of where you are • To identify any significant changes in the project • It assists in communications • It is good management practice! • It is, in some cases, an EU requirement
What is to be monitored 1? Examples in a Project • Beneficiary details • Staffing details • Project activity progress / milestones / deadlines vs plan • Quality checks • Attendance records • Finance – income • Finance – costs vs budget
What is to be monitored 2? Examples in a Programme • Outputs • No of people trained • No. courses completed / % passing approved test • No of people on study tours / placements • Results • Higher quality of project fiches • Improved contracting rate • Impact • Improved absorption of EU funds
Data needed • Inputs Monitoringof the project or programme • Outputs Monitoringof the project or programme • Results Evaluation of the project or programme • Impact Evaluation of the project or programme
Identifying Indicators for Monitoring • How to measure what we get is what we ordered and pay for? • Project duration • Deliverables • Activity plan / • milestones / phases • Activities • Reporting incl handover certificates etc • Indicators and sources of verification • Baseline indicators • Performance indicators for managing the project • Monitoring • Staff • Recording • Reporting • Communicating
Practical exercise to identify the information required to monitor a project
Monitoring data exercise • A project is working directly with young people with a disability to improve confidence, assertiveness and presentation. Each young person will have a mentor – an older person with a disability who is successful in their chosen employment. At the same time the project is raising awareness with employers of the value of employing young people with a disability. The ultimate aim is for the young people to get jobs in the open labour market. The project is funded by the ESF and in order to be eligible all the beneficiaries must be aged between 16 and 24, be unemployed and have a disability. • What information would be required for monitoring?
Definition of Evaluation? • A time-bound assessment that systematically and objectively assesses the relevance, performance, success and effectiveness of ongoing and completed programmes and projects.
Why Evaluate? • Reporting of results to: • Funders • Project promoter • Local partners • Peer organisations • Transnational audiences • Beneficiaries
Project Evaluation Project evaluation is a structured process comprising: Collection of relevant information Assessment of this information against agreed criteria Reporting of the evaluation results Incorporation of these results into future planning
Project Evaluation Gathering information
Programme Evaluation • Ex Ante (Before) • Can the programme achieve the results set out in the plan? • Mid Term (Mid way) • How are we doing and what changes are needed? • Ex Post (After) • What did we achieve vs plan?
Evaluation and Indicators • Relevance • Efficiency • Effectiveness • Impact • Sustainability
Evaluation and Indicators Socio-economic problems Impact Needs Results Programme Objectives Inputs Operations Outputs Efficiency Relevance Effectiveness Sustainability Evaluation
One for the road! • It is not necessarily a crime to be running late………… • ……..It is always a crime not to know! • You can only manage the work that remains to be done! • Getting people to think ahead • is 50% of the benefit of project planning • A successful project is one that where outputs are delivered on time, on budget, at the required quality……. • …….and no one died of a heart attack