Vertical Curves
Vertical Curves. Chapter 25. Profiles:. Curve a: Crest Vertical Curve (concave downward) Curve b: Sag Vertical Curve (concave upward). Tangents: Constant Grade (Slope). Equal-Tangent Vertical Parabolic Curve:. Terms:. BVC: Beginning of Vertical Curve aka PVC V: Vertex aka PVI


Vertical Curves
E N D
Presentation Transcript
Vertical Curves Chapter 25
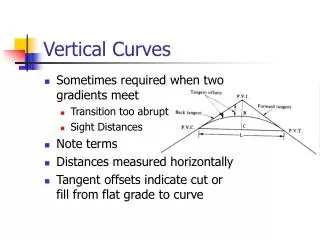
Profiles: Curve a: Crest Vertical Curve (concave downward) Curve b: Sag Vertical Curve (concave upward) Tangents: Constant Grade (Slope)
Terms: BVC: Beginning of Vertical Curve aka PVC V: Vertex aka PVI EVC: End of Vertical Curve aka PVT g1: percent grade of back tangent g2: percent grade of forward tangent L: curve length (horizontal distance) in feet or stations x: horizontal distance from any point on the curve to the BVC r: rate of change of grade
Equations: r = (g2 – g1)/L where: g2 & g1 - in percent (%) L – in stations and Y = YBVC + g1x + (r/2)x2 where: YBVC – elevation of the BVC in feet
Example: Equal-Tangent Vertical Curve Given the information show below, compute and tabulate the curve for stakeout at full 100’ stations.
Solution: L = STAEVC – STABVC L = 4970 – 4370 = 600’ or 6 fullstations r = (g2 – g1) / L r = (-2.4 – 3) / 6 r = -0.90 r/2 = -0.45 % per station STABVC = STAVertex – L / 2 = 4670 – 600/2 = STABVC= STA 43 + 70 STAEVC = STAVertex + L / 2 = 4670 + 600/2 = STAEVC= STA 49 + 70 ElevBVC = Elevvertex – g1 (L/2) = 853.48 – 3.00 (3) = 844.48’ ElevEVC = Elevvertex – g2 (L/2) = 853.48 – 2.40 (3) = 846.28 ’
Solution:(continued) r/2 = -0.45 % per station Elevx = ElevBVC + g1x + (r/2)x2 Elev 44 + 00 = 844.48 + 3.00(0.30) –0.45(0.30)2 = 845.34’ Elev 45 + 00 = 844.48 + 3.00(1.30) –0.45(1.30)2 = 847.62’ Elev 46 + 00 = 844.48 + 3.00(2.30) –0.45(2.30)2 = 849.00’ etc. Elev 49 + 00 = 844.48 + 3.00(5.30) –0.45(5.30)2 = 847.74’ Elev 49 + 70 = 844.48 + 3.00(6.00) –0.45(6.00)2 = 846.28’ (CHECKS)
High and Low Points on Vertical Curves Sag Curves: Low Point defines location of catch basin for drainage. Crest Curves: High Point defines limits of drainage area for roadways. Also used to determine or set elevations based on minimum clearance requirements.
Equation for High or Low Point on a Vertical Curve: y = yBVC + g1x + (r/2)x2 Set dy/dx = 0 and solve for x to locate turning point 0 = 0 + g1 + r x Substitute (g2 – g1) / L for r -g1 = x (g2 – g1) / L -g1 L = x (g2 – g1) x = (-g1 L) / (g2 – g1) or x = (g1 L) / (g1 – g2) = g1/r x – distance from BVC to HP or LP
Example: High Point on a Crest Vertical Curve From previous example: g1 = + 3 %, g2 = - 2.4%, L = 600’ = 6 full stations, r/2 = - 0.45, ElevBVC = 844.48’ x = (g1 L) / (g1 – g2) x = (3)(6) / (3 + 2.4) = 3.3333 stations or 333.33’ HP STA = BVC STA + x HP STA = 4370 + 333.33 = HP STA 47 + 03.33 ELEVHP = 844.48 + 3.00(3.3333) – 0.45(3.3333)2 = 849.48’ Check table to see if the computed elevation is reasonable!
Unequal-Tangent Parabolic Curve A grade g1of -2% intersects g2 of +1.6% at a vertex whose station and elevation are 87+00 and 743.24, respectively. A 400’ vertical curve is to be extended back from the vertex, and a 600’ vertical curve forward to closely fit ground conditions. Compute and tabulate the curve for stakeout at full stations.
Solution: The CVC is defined as a point of compound vertical curvature. We can determine the station and elevation of points A and B by reducing this unequal tangent problem to two equal tangent problems. Point A is located 200’ from the BVC and Point B is located 300’ from the EVC. Knowing this we can compute the elevation of points A and B. Once A and B are known we can compute the grade from A to B thus allowing us to solve this problem as two equal tangent curves.Pt. A STA 85 + 00, Elev. = 743.24 + 2 (2) = 747.24’Pt. B STA 90 + 00, Elev. = 743.24 + 1.6 (3) = 748.04’
Solution (continued): The grade between points A and B can now be calculated as:gA-B = 748.04 - 747.24 = +0.16% 5and the rate of curvature for the two equal tangent curves can be computed as: and Therefore: r1/2 = +0.27 and r2/2 = +0.12
Solution (continued): The station and elevations of the BVC, CVC and EVC are computed as:BVC STA 83 + 00, Elev. 743.24 + 2 (4) = 751.24’EVC STA 93 + 00, Elev. 743.24 + 1.6 (6) = 752.84’CVC STA 87 + 00, Elev. 747.24 + 0.16 (2) = 747.56’Please note that the CVC is the EVC for the first equal tangent curve and the BVC for the second equal tangent curve.
Designing a Curve to Pass Through a Fixed Point Design a equal-tangent vertical curve to meet a railroad crossing which exists at STA 53 + 50 and elevation 1271.20’. The back grade of -4% meets the forward grade of +3.8% at PVI STA 52 + 00 with elevation 1261.50.
Solution (continued): Check by substituting x = [(9.1152/2)+1.5] stations into the elevation equation to see if it matches a value of 1271.20’
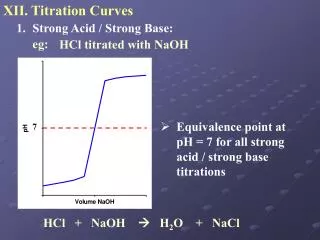
Sight Distance • Defined as “the distance required, for a given design speed to safely stop a vehicle thus avoiding a collision with an unexpected stationary object in the roadway ahead” by AASHTO (American Association of State Highway and Transportation Officials) • Types • Stopping Sight Distance • Passing Sight Distance • Decision Sight Distance • Horizontal Sight Distance
Sight Distance Equations For Crest Curves For Sag Curves h1: height of the driver’s eye above the roadway h2: height of an object sighted on the roadway AASHTO recommendations: h1 = 3.5 ft, h2 = 0.50 ft (stopping), h2 = 4.25 ft (passing) Lengths of sag vertical curves are based upon headlight criteria for nighttime driving conditions.