Bayesian networks
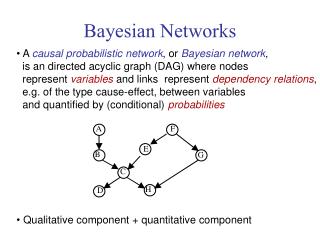
Bayesian networks. Weather data. What is the Bayesian Network corresponding to Naïve Bayes?. “Effects” and “Causes” vs. “Evidence” and “Class”. Why Naïve Bayes has this graph? Because when we compute in Naïve Bayes: P(play=yes | E) = P(Outlook=Sunny | play=yes) *

Bayesian networks
E N D
Presentation Transcript
Weather data What is the Bayesian Network corresponding to Naïve Bayes?
“Effects” and “Causes” vs. “Evidence” and “Class” • Why Naïve Bayes has this graph? • Because when we compute in Naïve Bayes: P(play=yes | E) = P(Outlook=Sunny | play=yes) * P(Temp=Cool | play=yes) * P(Humidity=High | play=yes) * P(Windy=True | play=yes) * P(play=yes) / P(E) we are interested in computing P(…|play=yes), which are probabilities of our evidence “observations” given the class. • Jelas, “play” bukan penyebab “outlook”, “temperature”, “humidity”, dan “windy”. • Akan tetapi, “play” adalahclassdandiketauhui memiliki nilai tertentu, akan mempengaruhi probabilitas kejadian . • Misl , if play=yes, dan kita tahu bahwa permainan akan dilakukan diluar lebih mungkin jika outlook the playing happens indoors, kemungkinan diluar outlook “rainy”
Causality is not a well understood concept. No widely accepted denition. No consensus on whether it is a property of the world or a concept in our minds Sometimes causal relations are obvious: Alarm causes people to leave building. Lung Cancer causes mass on chest X-ray. At other times, they are not that clear. Doctors believe smoking causes lung cancer but the tobacco industry has a different story: Casual BN Surgeon General (1964) S C Tobacco Industry * S C
Right or Wrong Topology? • In general, there is no right or wrong graph topology. • Of course the calculated probabilities (from the data) will be different for different graphs. • Some graphs will induce better classifiers than some other. • If you reverse the arrows in the previous figure, then you get a pure causal graph, • whose induced classifier might have estimated error (through cross-validation) better or worse than the Naïve Bayes one (depending on the data). • If the topology is constructed manually, we (humans) tend to prefer the causal direction.
Play probability table Based on the data… P(play=yes) = 9/14 P(play=no) = 5/14 Let’s correct with Laplace … P(play=yes) = (9+1)/(14+2) = .625 P(play=yes) = (5+1)/(14+2) = .375
Outlook probability table Based on the data… P(outlook=sunny|play=yes) = (2+1)/(9+3) = .25 P(outlook=overcast|play=yes) = (4+1)/(9+3) = .417 P(outlook=rainy|play=yes) = (3+1)/(9+3) = .333 P(outlook=sunny|play=no) = (3+1)/(5+3) = .5 P(outlook=overcast|play=no) = (0+1)/(5+3) = .125 P(outlook=rainy|play=no) = (2+1)/(5+3) = .375
Windy probability table Based on the data…let’s find the conditional probabilities for “windy” P(windy=true|play=yes,outlook=sunny) = (1+1)/(2+2) = .5
Windy probability table Based on the data… P(windy=true|play=yes,outlook=sunny) = (1+1)/(2+2) = .5 P(windy=true|play=yes,outlook=overcast) = 0.5 P(windy=true|play=yes,outlook=rainy) = 0.2 P(windy=true|play=no,outlook=sunny) = 0.4 P(windy=true|play=no,outlook=overcast) = 0.5 P(windy=true|play=no,outlook=rainy) = 0.75
Final figure Classify it Classify it
Classify it P(play=yes|outlook=sunny, temp=cool,humidity=high, windy=true) = *P(play=yes) *P(outlook=sunny|play=yes) *P(temp=cool|play=yes, outlook=sunny) *P(humidity=high|play=yes, temp=cool) *P(windy=true|play=yes, outlook=sunny) = *0.625*0.25*0.4*0.2*0.5 = *0.00625
Classify it P(play=no|outlook=sunny, temp=cool,humidity=high, windy=true) = *P(play=no) *P(outlook=sunny|play=no) *P(temp=cool|play=no, outlook=sunny) *P(humidity=high|play= no, temp=cool) *P(windy=true|play=no, outlook=sunny) = *0.375*0.5*0.167*0.333*0.4 = *0.00417
Classify it P(play=yes|outlook=sunny, temp=cool,humidity=high, windy=true) = *0.00625 P(play=no|outlook=sunny, temp=cool,humidity=high, windy=true) = *.00417 = 1/(0.00625+0.00417) =95.969 P(play=yes|outlook=sunny, temp=cool,humidity=high, windy=true) = 95.969*0.00625 = 0.60
hidden variables P(play=yes|temp=cool, humidity=high, windy=true) = *outlookP(play=yes) *P(outlook|play=yes) *P(temp=cool|play=yes,outlook) *P(humidity=high|play=yes, temp=cool) *P(windy=true|play=yes,outlook) =…(next slide)
P(play=yes|temp=cool, humidity=high, windy=true) = *outlookP(play=yes)*P(outlook|play=yes)*P(temp=cool|play=yes,outlook) *P(humidity=high|play=yes,temp=cool)*P(windy=true|play=yes,outlook) = *[ P(play=yes)*P(outlook= sunny|play=yes)*P(temp=cool|play=yes,outlook=sunny) *P(humidity=high|play=yes,temp=cool)*P(windy=true|play=yes,outlook=sunny) +P(play=yes)*P(outlook= overcast|play=yes)*P(temp=cool|play=yes,outlook=overcast) *P(humidity=high|play=yes,temp=cool)*P(windy=true|play=yes,outlook=overcast) +P(play=yes)*P(outlook= rainy|play=yes)*P(temp=cool|play=yes,outlook=rainy) *P(humidity=high|play=yes,temp=cool)*P(windy=true|play=yes,outlook=rainy) ] = *[ 0.625*0.25*0.4*0.2*0.5 + 0.625*0.417*0.286*0.2*0.5 + 0.625*0.33*0.333*0.2*0.2 ] =*0.01645
hidden variables P(play=no|temp=cool, humidity=high, windy=true) = *outlookP(play=no)*P(outlook|play=no)*P(temp=cool|play=no,outlook) *P(humidity=high|play=no,temp=cool)*P(windy=true|play=no,outlook) = *[ P(play=no)*P(outlook=sunny|play=no)*P(temp=cool|play=no,outlook=sunny) *P(humidity=high|play=no,temp=cool)*P(windy=true|play=no,outlook=sunny) +P(play=no)*P(outlook= overcast|play=no)*P(temp=cool|play=no,outlook=overcast) *P(humidity=high|play=no,temp=cool)*P(windy=true|play=no,outlook=overcast) +P(play=no)*P(outlook= rainy|play=no)*P(temp=cool|play=no,outlook=rainy) *P(humidity=high|play=no,temp=cool)*P(windy=true|play=no,outlook=rainy) ] = *[ 0.375*0.5*0.167*0.333*0.4 + 0.375*0.125*0.333*0.333*0.5 + 0.375*0.375*0.4*0.333*0.75 ] =*0.0208
Classification VII (missing values or hidden variables) P(play=yes|temp=cool, humidity=high, windy=true) =*0.01645 P(play=no|temp=cool, humidity=high, windy=true) =*0.0208 =1/(0.01645 + 0.0208)= 26.846 P(play=yes|temp=cool, humidity=high, windy=true) = 26.846 * 0.01645 = 0.44 P(play=no|temp=cool, humidity=high, windy=true) = 26.846 * 0.0208 = 0.56 I.e. P(play=yes|temp=cool, humidity=high, windy=true) is 44% and P(play=no|temp=cool, humidity=high, windy=true) is 56% So, we predict ‘play=no.’
How Weka finds the shape of the graph? Fixes an order of attributes (variables) and then adds and removes arcs until it gets the smallest estimated error (through cross-validation). By default it starts with a Naïve Bayes network. Also, it maintains a score of graph complexity, trying to keep the complexity low.
Laplace correction. Better change it to 1, to be compatible with the counter initialization in Naïve Bayes. It is going to start with a Naïve Bayes graph and then try to add/remove arcs. You can change to 2 for example. If you do, then the max number of parents for a node will be 2.