Solving Equations Using Bar Diagrams: A Practical Guide
This guide explores the use of bar diagrams to model and solve mathematical equations effectively. Through a series of examples, including solving for the number of boys and girls in specific scenarios and determining the cost of new and used books, readers will learn to write and manipulate equations with clarity. The bar diagram method simplifies complex problems into visual representations, making it easier to find unknown values. This resource is perfect for students and educators looking to enhance their algebra skills through visual learning.

Solving Equations Using Bar Diagrams: A Practical Guide
E N D
Presentation Transcript
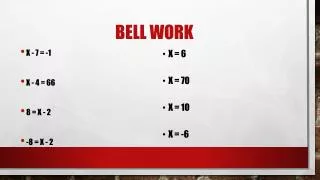
Bell Work • X = 6 • X = 70 • X = 10 • X = -6 • X - 7 = -1 • X - 4 = 66 • 8 = X - 2 • -8 = X - 2
Use the model to write and solve an equation X + 134 = 253 or 134 + x = 253 X = 119 boys
Use the model to write and solve an equation X – 15 = 119 X = 134 girls
Use the model to write and solve an equation X + 15 = 134 X = 119 boys
Use the model to write and solve an equation X + 119 = 134 X = 15 more girls
A used book costs $17 less than the same book new. The used book costs $9. Use a bar diagram to write and solve an equation to find out how much the new book cost. ? X – 9 = 17 New book Used book X = $26 for a new book 9 17
Use a bar diagram to write and solve an equation to find out how many hits he got in the second game. . X – 1 = 5 X = 4 hits in the second game
Use the model to write and solve an equation X + 4 = 7 X = 3
Use the model to write and solve an equation X + 2 = 6 X = 4