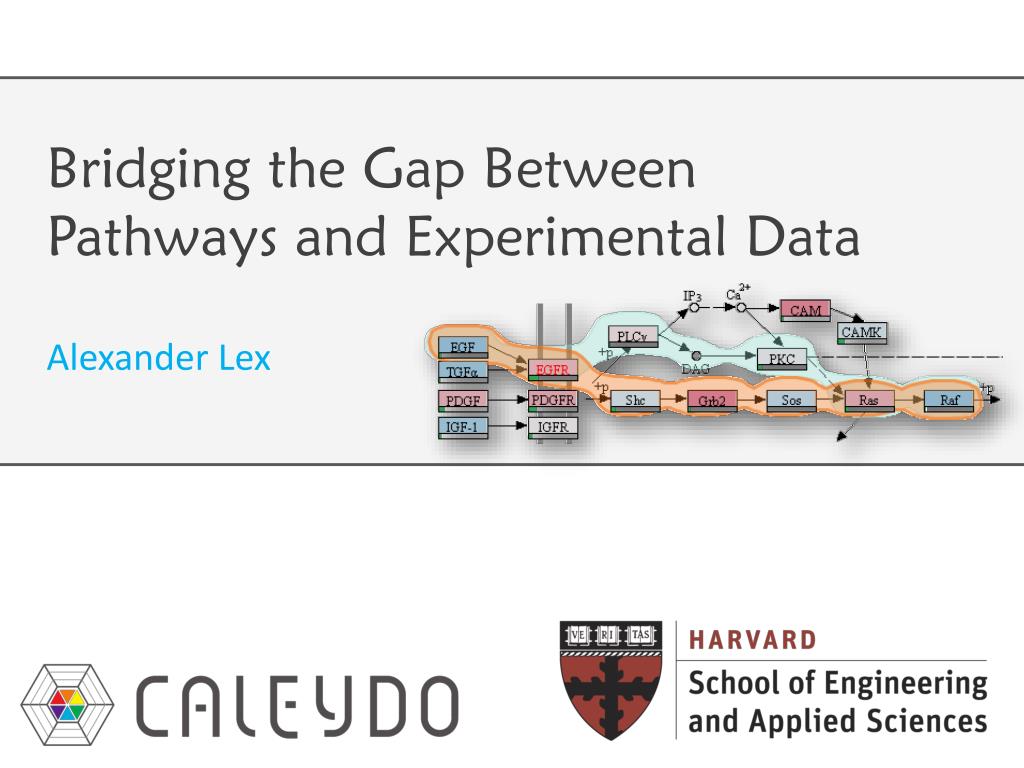
Bridging the Gap Between Pathways and Experimental Data. Alexander Lex. Experimental Data and Pathways. Pathways represent consensus knowledge for a healthy organism or specific disease Cannot account for variation found in real-world data Branches can be (in)activated due to
01 / 65Bridging the Gap Between Pathways and Experimental Data
1 / 17
Télécharger la présentation
Bridging the Gap Between Pathways and Experimental Data
Une image / un lien ci-dessous est fourni (tel quel) pour télécharger la présentation
Politique de téléchargement : le contenu du site vous est fourni TEL QUEL pour votre information et votre usage personnel ; il ne peut être vendu, concédé sous licence ni partagé sur d’autres sites sans l’accord de son auteur.Le contenu vous est fourni TEL QUEL, pour votre information et votre usage personnel uniquement.Téléchargez la présentation en cliquant sur ce lien.Lors du téléchargement, si vous ne parvenez pas à télécharger une présentation, l’éditeur a peut-être supprimé le fichier de son serveur.Pendant le téléchargement, si vous ne parvenez pas à obtenir une présentation, le fichier a peut-être été supprimé par l’éditeur.
Experimental Data and Pathways • Pathways represent consensus knowledge for a healthy organism or specific disease • Cannot account for variation found in real-world data • Branches can be (in)activated due to • mutation, • changed gene expression, • modulation due to drug treatment, • etc. Alexander Lex | Harvard University
Why use Visualization? • Efficient communication of information • A -3.4 • B 2.8 • C 3.1 • D -3 • E 0.5 • F 0.3 B A C D E F Alexander Lex | Harvard University
What to Consider when Visualizing Experimental Data and Pathways • Conflicting Goals • Preserving topology of pathways • Showing lots of experimental data • Five Requirements • Ideal visualization technique addresses all Alexander Lex | Harvard University
R I: Data Scale • Large number of experiments • Large datasets have more than 500 experiments • Multiple groups/conditions Alexander Lex | Harvard University
R II: Data Heterogeneity • Different types of data, e.g., • mRNA expression numerical • mutation status categorical • copy number variation ordered categorical • metabolite concentration numerical • Require different visualization techniques Alexander Lex | Harvard University
R III: Multi-Mapping • Pathways nodes are biomolecules • Proteins, nucleic acids, lipids, metabolites • Experimental data often on a „gene“ level • Multiple genes can produce protein • Multiple genes encode one protein • Result: many „gene“ values map to one pathway node CA3 C KJ2 RAF E1 E2 E E3 E4 Alexander Lex | Harvard University
R IV: Preserving the Layout • Pathways are available in carefully designed layouts • e.g., KEGG, WikiPathways, Biocarta • Users are familiar with layouts • Goal: preserve layouts as much as possible • Two approaches: • Emulate drawing conventions • Use original layouts Alexander Lex | Harvard University
R V: Supporting Multiple Tasks • Two central tasks: • Explore topology of pathway • Explore the attributes of the nodes (experimental data) • Need to support both! B A C D E F Alexander Lex | Harvard University
On-Node Mapping • Not scalable • especially when used with „original“ layout • animation not an alternative • Good for overview with homogeneous data • Excellent for topology-based tasks • Bad for attribute-based tasks Alexander Lex | Harvard University
On-Node Mapping Reflection • R I (Scale) • bad if working with static layouts • limited when working with layout adaption • R II (Heterogeneity) • bad – can‘t encode multiple datasets • R III (Multi-Mapping) • bad – can‘t encode multiple mappings Alexander Lex | Harvard University
On-Node Mapping Reflection • R IV (Layout-Preservation) • excellent! • R V (Multiple Tasks) • excellent for topology-based tasks • bad for attribute-based tasks Alexander Lex | Harvard University
Visualization Approaches [Lindroos 2002] On-Node Mapping Small Multiples Separate Linked Views [Meyer 2010] [Junker 2006] Layout Adaption Linearization Path-Extraction Alexander Lex | Harvard University
Separate Linked Views Reflection • R I (Scale) • excellent for large numbers of attributes • R II (Heterogeneity) • excellent for heterogeneous data • e.g., one view per data type • R III (Multi-Mapping) • good – simple highlighting for multiple elements Alexander Lex | Harvard University
Separate Linked Views Reflection • R IV (Layout-Preservation) • excellent! • R V (Multiple Tasks) • good for topology-based tasks • good for attribute-based tasks • awful for combining them! • Association node-attribute only one by one Alexander Lex | Harvard University
Visualization Approaches [Lindroos 2002] On-Node Mapping Small Multiples Separate Linked Views [Meyer 2010] [Junker 2006] Layout Adaption Linearization Path-Extraction Alexander Lex | Harvard University
Small Multiples Video! [Barsky 2008] Alexander Lex | Harvard University
Small Multiples Reflection • R I (Scale) • limitedto a handful of conditions/experiments • differences don‘t „pop out“ • R II (Heterogeneity) • limitedfor heterogeneous data • e.g., one view per data type • R III (Multi-Mapping) • bad – no obvious solution Alexander Lex | Harvard University
Small Multiples Reflection • R IV (Layout-Preservation) • excellent! • R V (Multiple Tasks) • good for topology-based tasks • limited for attribute-based tasks • limitedfor combining them! • comparing one by one -> change blindness • Typically requires „focus duplicate“ Alexander Lex | Harvard University
Visualization Approaches [Lindroos 2002] On-Node Mapping Small Multiples Separate Linked Views [Meyer 2010] [Junker 2006] Layout Adaption Linearization Path-Extraction Alexander Lex | Harvard University
Layout Adaption • „Moderate“ Layout Adaption • make space for on-node encoding [Gehlenborg 2010] [Junker 2006] Alexander Lex | Harvard University
Layout Adaption • „Extreme“ layout adaption • encode information throughposition Video: http://www.youtube.com/watch?v=NLiHw5B0Mco [Bezerianos 2010] Alexander Lex | Harvard University
Layout Adaption Reflection • R I (Scale) • limitedto a handful of conditions/experiments • R II (Heterogeneity) • limitedfor heterogeneous data • Different story for „extreme“ layout adaption • R III (Multi-Mapping) • OK– give nodes with multi-mappings extra space Alexander Lex | Harvard University
Layout Adaption Reflection • R IV (Layout-Preservation) • not possible • R V (Multiple Tasks) • limitedfor topology-based tasks • limited for attribute-based tasks • limitedfor combining them! • space for trade-off between topology and attribute tasks Alexander Lex | Harvard University
Visualization Approaches [Lindroos 2002] On-Node Mapping Small Multiples Separate Linked Views [Meyer 2010] [Junker 2006] Layout Adaption Linearization Path-Extraction Alexander Lex | Harvard University
Linearization – Pathline • Combination of • layout adaption • separate linked views [Meyer 2010] Alexander Lex | Harvard University
Linearization [Meyer 2010] Alexander Lex | Harvard University
Linearization Reflection • R I (Scale) • goodfor many experiments • R II (Heterogeneity) • goodfor multiple datasets • R III (Multi-Mapping) • good – give nodes with multi-mappings extra space Alexander Lex | Harvard University
Linearization Reflection • R IV (Layout-Preservation) • not possible • R V (Multiple Tasks) • limitedfor topology-based tasks • limitedfor attribute-based tasks • limitedfor combining them! • Manual creation of linearized version • Unclear if suitable for more complex pathways Alexander Lex | Harvard University
Visualization Approaches [Lindroos 2002] On-Node Mapping Small Multiples Separate Linked Views [Meyer 2010] [Junker 2006] Layout Adaption Linearization Path-Extraction Alexander Lex | Harvard University
Concept Pathway View Pathway View enRoute View B B B A A A C C C D D D E E E F F F Group 1 Dataset 2 Group 1 Dataset 1 Group 2 Dataset 1 Alexander Lex | Harvard University
Pathway View • On-Node Mapping • Path highlighting with Bubble Sets [Collins2009] • Selection • Start- and end node • Iterative adding of nodes low high IGF-1 Alexander Lex | Harvard University
enRoute View – Path Representation • Design of KEGG[Kanehisa2008] • Abstract branch nodes • Additional topological information • Incoming vs. outgoing branches • Expandable • Branch switching Alexander Lex | Harvard University
Experimental Data Representation • Gene Expression Data (Numerical) • Copy Number Data (Ordered Categorical) • Mutation Data Alexander Lex | Harvard University