Chapter 3 Demand and Supply The Basics
410 likes | 589 Vues
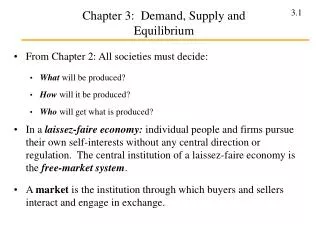
Chapter 3 Demand and Supply The Basics. Demand and Supply. Markets are the institutions that bring together buyers and sellers. Examples include: farmer ’ s markets, eBay, Amazon.com, and retail outlets. Demand vs. Quantity Demanded.

Chapter 3 Demand and Supply The Basics
E N D
Presentation Transcript
Chapter 3 Demand and Supply The Basics
Demand and Supply Marketsare the institutions that bring together buyers and sellers. • Examples include: farmer’s markets, eBay, Amazon.com, and retail outlets.
Demand vs. Quantity Demanded • Demand is the amount of a product that consumers are willing and able to purchase at each possible price during a given period of time, everything else (but price) held constant. (ceteris paribus) • It is a relationship between prices and quantities.
Law of Demand • Law of Demand: There is an inverse relationship between the price of a good and the quantity consumers are willing and able to purchase during a particular period of time. • As price of a good rises, consumers buy less. • Demand depicts the quantity-price relationship ceteris paribus.
Demand vs. Quantity Demanded • The quantity demandedis the amount of a product that people are willing and able to purchase at one, specific price. • It is a specific quantity tied to a specific price.
Demand Curve • A graphical representation of Demand
Changes in Demand and Quantity Demanded • Change in Quantity Demanded - movement along the same demand curve in response to a price change. • Results from a price change • A movement along a curve • Change in Demand - shift in entire demand curve. • Results from a change in a determinant of demand (a ceteris paribus variable) • A whole new curve
Important mathematical/scientific symbol Δ delta Δ stands for CHANGE
Law of Demand • The Demand Shifters are factors other than price that influence demand: income, tastes, prices of related goods, expectations, and numbers of buyers. • Δ Demand Shifters leads to Δ DEMAND itself – ie a whole new demand curve
Demand Shifters • Changes in Consumer Income • Normal goods: goods for which demand increases as income increases. • Inferior goods: goods for which demand decreases as income increases.
Demand Shifters • Δ the Number of Buyers • Δ Demographic Characteristics
Demand Shifters • Δ Price of Related Goods • Substitute goods: goods that can be used in place of each other. • Complementary goods: goods that are used together.
Demand Shifters • ΔConsumer Expectations Should I Buy Now??? New! Faster! Cheaper!
Demand Shifters • Δ Consumer Tastes and Preferences
Supply and Quantity Supplied • Supply is the amount of a good or service that producers are willing and able to offer for sale at each possible price during a period of time, ceteris paribus. • It is a price-quantity relationship. • The quantity supplied is the amount sellers are willing and able to offer for sale during a period of time at a specific price, ceteris paribus. • It is a specific quantity tied to a specific price
Law of Supply • Law of Supply - there is a positive relationship between the price of a product and the amount of it that will be supplied. • As the price of a product rises, producers will be willing to supply more. • The height of the supply curve at any quantity also shows the opportunity cost ofproducing the next unitof the good.
Supply Curve • A graphical representation of Demand
The Supply Curve and the PPF • The production possibility frontier provides one explanation of why the supply curve has a positive slope • As the quantity of chicken produced increases, the opportunity cost of producing it increases, as shown by the increasing slope of the PPF
Changes in Supply • Δ Quantity Supplied - movement along the same supply curve in response to a price change. • Results from Δ price • Movement along a curve • Δ Supply - shift in entire supply curve. • Results from Δ some other variables besides price. (Δ a ceteris paribus variable) • Whole new curve
Supply Shifters • Δ Resource Prices Oil Prices Falling Wages
Supply Shifters • Δ Technology and Productivity
Supply Shifters • Δ Expectations of Producers The TIMES Mideast War Likely Future oil supplies uncertain
Supply Shifters • Δ Number of Producers • Δ Prices of Related Goods or Services • the opportunity cost of producing any good is the lost production of some other good Wheat
Supply NEVER goes UP or DOWN!!! • Supply Increases or Decreases • Supply shifts right or left • Supply NEVER, NEVER, NEVER goes UP or DOWN!! – not ever. Note: The textbook uses the Up/Down language in an example in CH 3. It may be “technically” OK, but it WILL confuse you if you use it!!!
Equilibrium • When the plans of buyers and sellers mesh when tested in the market place, the market is in equilibrium • If the price is too high, there will be a surplus • If the price is too low, there will be a shortage
Equilibrium • The just right Price where qD = qS • Markets tend towards equilibrium unless something prevents price adjustments
Clicker • Which diagram best represents the effect on the market for beef of an increase in the cost of corn used as feed for beef cattle? • A: A B: B C: Can’t tell A B
Clicker • Which of the charts represents what might happen if a report that eating beef will increase the likelihood of a fatal heart attacks was newly released. • A: A B: B C: Can’t tell A B
Clicker • The Graph labeled A would be described as • A decrease in Demand • A decrease in quantity demanded • A decrease in supply • A decrease in quantity supplied A B
Clicker • The Graph labeled B would be described as • A decrease in Demand • A decrease in quantity demanded • A decrease in supply • A decrease in quantity supplied A B
Disequilibrium • A surplus occurs whenever qS>qD. • A shortage occurs whenever qD>qS. • Surpluses and shortages can be resolved with price changes.
Simultaneous Decreases in Demand and Supply: countervailing pressures
Simultaneous Shifts
Group Project The Market for Pickup Trucks is in equilibrium. What happens in this market with each of the following changes? Draw a graphical representation and identify what happens in the market for Pickup Trucks to (A) Supply, (B) Demand, (C) Price in the market for pickup trucks, ceteris paribus, (D) Equilibrium Quantity Demanded and Quantity Supplied? • Price of Passenger cars goes up dramatically: • A public campaign encouraging conservation of fuel by using public transportation and small cars whenever possible creates a change in preferences: • The price of tires quadruples: • A huge strike hits truck manufacturers, shutting down many plants: • Gasoline prices plummet to $0.02 per gallon: • The price of steel is cut in half: • A major recession strikes and income levels drop: • The price of camp trailers drops by 90%: Market for Pick up trucks C D A B