Download

1 / 29
290 likes | 327 Vues
Learn about demand and supply, equilibrium price, quantity determination, and market dynamics. Explore concepts with examples and graphs to understand shifts and movements within the demand and supply curves.

E N D
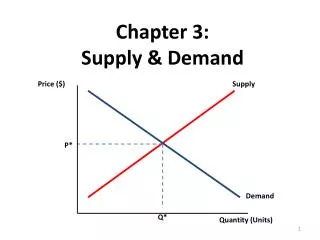
Chapter 3 Demand and Supply
Demand and Supply • Marketsare the institutions that bring together buyers and sellers. • Examples include: farmer’s markets, eBay, Amazon.com, and retail outlets.
1. DEMAND Learning Objectives • Define the quantity demanded of a good or service and illustrate it using a demand schedule and a demand curve. • Distinguish between the following pairs of concepts: demand and quantity demanded, demand schedule and demand curve, movement along and shift in a demand curve. • Identify demand shifters and determine whether a change in a demand shifter causes the demand curve to shift to the right or to the left.
1.1 Price and the Demand Curve • Thequantity demanded is the quantity buyers are willing and able to buy of a good or service at a particular price during a particular period, all other things unchanged. • A demand schedule is a table that shows the quantities of a good or service demanded at different prices during a particular period, all other things unchanged. • A demand curve is a graphical representation of a demand schedule.
1.1 Price and the Demand Curve • Achange in quantity demanded is a movement along a demand curve that results from a change in price. • The law of demandstates that for virtually all goods and services, a higher price leads to a reduction in quantity demanded and a lower price leads an increase in quantity demanded.
A Demand Schedule and a Demand Curve The demand schedule lists points on the demand curve. 25 million pounds of coffee per month are demanded at a price of $6 per pound. 30 million pounds of coffee per month are demanded at a price of $5 per pound.
1.2 Changes in Demand • A change in demand is characterized by a shift in a demand curve. • A demand shifter is a variable that can change the quantity of a good or service demanded at each price. • Preferences • Prices of related goods and services • Complements and Substitutes • Income • Normal and Inferior goods • Demographic characteristics • Buyer expectations
An Increase in Demand A’ A D2 D1
A Reduction in Demand A’’ A D1 D3
Changes in Price Versus Changes in Demand Demand curve A reduction in demand An increase in demand Price per unit A change in price causes a movement Along the demand curve. Shifts the demand curve to the right Shifts the demand curve to the left Quantity per period
2. Supply Learning Objectives • Define the quantity supplied of a good or service and illustrate it using a supply schedule and a supply curve. • Distinguish between the following pairs of concepts: supply and quantity supplied, supply schedule and supply curve, movement along and shift in a supply curve. • Identify supply shifters and determine whether a change in a supply shifter causes the supply curve to shift to the right or to the left.
2.1 Price and the Supply Curve • The quantity supplied is the quantity sellers are willing to sell of a good or service at a particular price during a particular period, all other things unchanged. • A supply scheduleis a table that shows quantities supplied at different prices during a particular period, all other things unchanged. • A supply curveis a graphical representation of a supply schedule. • A change in quantity supplied is characterized by movement along the supply curve caused by a change in price.
A Supply Schedule and a Supply Curve The supply schedule lists points on the supply curve. 30 million pounds of coffee per month are supplied at a price of $7 per pound. 25 million pounds of coffee per month are supplied at a price of $6 per pound.
2.2 Changes in Supply • A change in supply is characterized by a shift in the supply curve. • A supply shifter is a variable that can change the quantity of a good or service supplied at each price. • Prices of factors of production • Returns from alternative activities • Technology • Seller expectations • Natural events • The number of sellers
An Increase in Supply A A’ S1 S2
A Reduction in Supply A’’ A S3 S1
Changes in Price Versus Changes in Supply Supply curve A reduction in supply An increase in supply Price per unit A change in price causes a movement Along the supply curve. Shifts the supply curve to the right Shifts the supply curve to the left Quantity per period
3 Demand, Supply, and Equilibrium • Learning Objectives • Use demand and supply to explain how equilibrium price and quantity are determined in a market. • Understand the concepts of surpluses and shortages and the pressures on price they generate. • Explain the impact of a change in demand or supply on equilibrium price and quantity. • Explain how the circular flow model provides an overview of demand and supply in product and factor markets and how the model suggests ways in which these markets are linked.
3.1 The Determination of Price and Quantity • TheEquilibrium price(market clearing price)is the price at which quantity demanded equals quantity supplied. • TheEquilibrium quantityis the quantity demanded and supplied at the equilibrium price. • ASurplus is the amount by which the quantity supplied exceeds the quantity demanded at the current price. • AShortage is the amount by which the quantity demanded exceeds the quantity supplied at the current price.
The Determination of Equilibrium Price and Quantity Surplus at P = $8 At a price of $8 per pound, 35 million pounds of coffee are supplied At a price of $8 per pound, 15 million pounds of coffee are demanded S Equilibrium price and quantity At a price of $4 per pound, 15 million pounds of coffee are supplied D At a price of $4 per pound, 35 million pounds of coffee are demanded Shortage at P = $4
3.2 Shifts in Demand and Supply S1 D2 D1 D2
3.2 Shifts in Demand and Supply S2 S2 S1 D1
Simultaneous Decreases in Demand and Supply S2 S1 D1 D2
Simultaneous Decreases in Demand and Supply S1 S2 D2 D1
Simultaneous Decreases in Demand and Supply S1 S2 D2 D1
3.3 An Overview of Demand and Supply: The Circular Flow Model • Thecircular flow modelis a model that provides a look at how markets work and how they are related to each other. • The Product marketsare markets in which firms supply goods and services demanded by households. • The Factor marketsare markets in which households supply factors of production – labor, capital, and natural resources – demanded by firms.
3.3 An Overview of Demand and Supply: The Circular Flow Model Payments to firms for goods and services Product markets S S S Price Price Price D D D Apartments Blue jeans Haircuts Supply goods and services Demand goods and services Households Firms Demand factors And supply factors Factors markets S S S Price Price Price D D D Textile workers Barbers Apartment buildings Wages paid to household for labor