CHAPTER 3 Supply and Demand
CHAPTER 3 Supply and Demand. What you will learn in this Chapter. 1. What a competitive market is & how it is described by the supply & demand model 2. What a demand curve is & t he difference between movements along a demand curve & shifts of a demand curve

CHAPTER 3 Supply and Demand
E N D
Presentation Transcript
CHAPTER 3 Supply and Demand
What you will learn in this Chapter 1. What a competitive market is & how it is described by the supply & demand model 2. What a demand curve is & the difference between movements along a demand curve & shifts of a demand curve 3. What a supply curve is & the difference between movements along a supply curve & shifts of a supply curve 4. How the supply & demand curves determine a market’s equilibrium price & equilibrium quantity 5. In the case of a shortage or surplus, how price moves the market back to equilibrium
1. Supply and Demand A competitive market is a market in which there are many buyers and sellers of the same good or service. The supply and demandmodel is a model of how a competitive market works. Five key elements in this model: The demand curve The supply curve The set of factors that cause the demand curve to shift, and the set of factors that cause the supply curve to shift The equilibrium price The way the equilibrium price changes when the supply and demand curves shift
Exercise 1: Now using demand schedule from problem 5 (p.80), draw the demand curve. Does this demand curve obey the “law of demand”?
2. Shifts of the Demand Curve Gretzky is retiring!!! • Announcement of Gretzky’s retirement generates an increase in demand, an increase in the quantity demanded at any given price. • The increase in demand shifts the demand curve to the right. • This event is represented by the two demand schedules: • Demand before the announcement • Demand after the announcement
2. “Movement Along” vs. “Shift” of the Demand Curve • from point A to point B: increase in quantity demanded reflects a movement along the demand curve • it is the result of a fall in the price of the good. • from point A to point C: increase in quantity demanded reflects a shift of the demand curve • It is the result of an increase in the quantity demanded at any given price.
Exercise 2: • The price of a can of Coke has increased from $1 to $3. Does this cause a movement along or a shift of the demand curve for Coke? Why? • A new scientific research has proven that Coke drinkers live on average 5 years longer. Does this finding cause a movement along or a shift of the demand curve for Coke? Why?
3. Shifts of the Demand Curve (continued) • an “increase in demand”, means a rightward shift of the demand curve: • at any given price, consumers demand a larger quantity than before. (D1 D2) • A decrease in demand means a leftward shift of the demand curve. • At any given price, consumers demand a smaller quantity than before. (D1D3)
2. What causes a demand curve to shift? • Changes in the Prices of Related Goods • Substitutes: Two goods are substitutes if a fall in the price of one of the goods makes consumers less willing to buy the other good. Ex.: muffins and donuts. • Complements: Two goods are complements if a fall in the price of one good makes people more willing to buy the other good. Ex: petrol and cars. • Changes in Income • Normal Goods: When a rise in income increases the demand for a good—the normal case—we say that the good is a normalgood. • Inferior Goods:When a rise in income decreases the demand for a good, it is an inferior good. Ex: instant noodles. • Changes in Tastes • Changes in Expectations
Exercise 3: • What would be the effect of a sharp increase in the price of tennis balls on the demand for tennis racquets? Why? • What would be the effect of a sharp increase in the price of Pepsi on the demand for Coke? Why? • As Victoria’s income goes up, she buys less instant noodles. What kind of a good is instant noodles for Victoria? • Following David Beckham and Sting, more men start to follow the fashion of wearing skirts. What would the effect of this change in tastes be on the demand for skirts? • Scientists announce that there will be no fish left in the oceans in 5 years. What would be the effect of this announcement on demand for sushi?
3. Supply curve Just as demand curves normally slope downwards, supply curves normally slope upwards: The higher the price being offered, the more people will be willing to part with their hockey tickets,… … or for that matter, the more of any good they will be willing to sell.
Exercise 4: Now using supply schedule from problem 5 (p.80), draw the demand curve. Does this supply curve obey the “law of supply”?
3. Shifts of the Supply Curve Gretzky is retiring!!! • Announcement of Gretzky’s retirement generates a decrease in supply, a decrease in the quantity supplied at any given price. • The decrease in supply shifts the supply curve to the left.
3. Shifts of the Supply Curve • Any “increase in supply” means a rightward shift of the supply curve: • at any given price, there is an increase in the quantity supplied. (S1 S2) • Any “decrease in supply” means a leftward shift of the supply curve: • at any given price, there is a decrease in the quantity supplied. (S1 S3) • The principal factors that shift the supply curve: • changes in the price of an input • changes in technology • changes in expectations.
3. “Movement Along” vs. “Shift” of the Supply Curve • from point A to point B: the decrease in quantity supplied reflects a movement along the supply curve • it is the result of a fall in the price of the good. • from point A to point C: the decrease in quantity supplied reflects a shift of the supply curve • It is the result of a decrease in the quantity supplied at any given price.
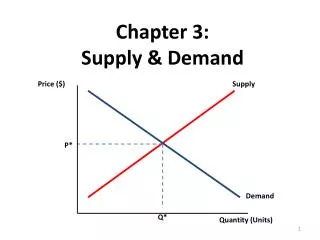
4. Finding the Equilibrium Price and Quantity • Let’s put the supply curve and the demand curve for that market on the same diagram. • Market equilibrium occurs at point E, where the supply curve and the demand curve intersect. • In equilibrium the quantity demanded is equal to the quantity supplied. • In this market the equilibrium price is $250 • And the equilibrium quantity is 8,000 tickets.
5. Why does the market price fall if it is above the equilibrium price? • Let’s say the market price of $350 is above the equilibrium price of $250 • This creates a surplus • This surplus will push the price down until it reaches the equilibrium price of $250. There is a surplus of a good when the quantity supplied exceeds the quantity demanded. Surpluses occur when the price is above its equilibrium level.
5. Why does the market price rise if it is below the equilibrium price? • Let’s say the market price of $150 is below the equilibrium price of $250. • This creates a shortage. • This shortage will push the price up until it reaches the equilibrium price of $250. There is a shortage of a good when the quantity demanded exceeds the quantity supplied. Shortages occur when the price is below its equilibrium level.
The End of Chapter 3 coming attraction:Chapter 4: The Market Strikes Back