Download
1 / 31
310 likes | 405 Vues
This research paper delves into the development and evaluation of Index-Based Livestock Insurance (IBLI) in Kenya using games as a teaching tool. The study analyzes game play data, timelines, the basic idea behind IBLI, research design, index construction, and the impact on households' income and asset protection. The paper details the collaboration with various institutions and researchers, the challenges faced, and the overall success of the initiative. By presenting findings from the game play and insurance purchase rounds, the paper sheds light on the effectiveness and challenges of implementing IBLI in the Kenyan context.

E N D
Explaining Index Based Livestock Insurance in Kenya through Games: Describing Our Approach and Analyzing Game Play. John McPeak,215 Eggers Hall,Department of Public Administration and International Affairs, Maxwell School of Citizenship and Public Affairs,Syracuse University.(315) 443-6146jomcpeak@maxwell.syr.edu
IBLI – Index Based Livestock Insurance • This research was made possible by support provided in part by the US Agency for International Development (USAID) Agreement No. EDH00-06-0003-00 awarded to the Assets and Market Access Collaborative Research Support Program (AMA CRSP). • This research was conducted in collaboration with Andrew Mude, Munenobu Ikegami, Sommarat Chantarat, Chris Barrett, and Michael Carter and other individuals at the International Livestock Research Institute, Cornell University, University of Wisconsin-Madison, The Australian National University, and the University of California-Davis. • All views, interpretations, recommendations, and conclusions expressed in this paper and presentation are those of the author and not necessarily those of the supporting or collaborating institutions.
TIMELINE • ALRMP gathering data from late 90’s to present in Arid Districts of Kenya. • PARIMA, a GL-CRSP funded project, active in Northern Kenya / Southern Ethiopia 1997-2008. • Quarterly panel data on 330 households from 2000 to 2002. • DFID launches HSNP in 2007; cash transfers to reduce poverty • IBLI begins in 2007 to develop index based livestock insurance • 2008 , Index Construction, WTP study, first round of extension games played. • 2009 game revision, baseline survey written and run, and second round of games played in 2009-10 • 2010 First round of insurance purchase in February-March, repeat survey in October to December • 2011 Second round of insurance purchase in February-March repeat survey in the field now. Some problems with the insurance partner led to lower sales than expected.
The Basic Idea • is Income for household i at time t • is a vector of productive assets for hh i , time t • is the rate of return on these productive assets, possibly as a function of asset levels. • is the household and period specific shock to the return on assets. • are household specific but time invariant income flows • is household and time specific transitory income • is household and time specific measurement error. • From Barrett et al. (2006) JDS paper. • Transfers such as Ui could raise income, impact future asset stocks, influence the rate of return to existing assets • Assets could be subject to stochastic shocks, say , with theta + gamma defined as shocks over the interval [0,1] from some stochastic distribution.
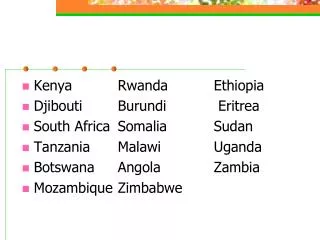
Research Design • IBLI is asset protection, reduce impact of shocks to A. • HNSP is cash transfer, works like U. • Sites with IBLI and HSNP • Sites with only IBLI or HSNP • Sites with neither • Full comparison is ahead
Top photo by John McPeak, Bottom photo by Sharon Osterloh
Google Earth Map of IBLI sites. Top photo by Chris Barrett, Bottom photo by John McPeak
NDVI Normal Year (May 2007) Drought Year (May 2009) From Chantarat and Mude 2011
What Is the Index Part? • Figure 3: zNDVI for North Horr and Dirib Gumbo 1990 to 2008 by season
Why Index Insurance for Livestock? • Figure 1: Share of Total Income from Different Sources, PARIMA data, Kenya sites, 2000-2002
Why Index Based Livestock Insurance? Figure 2: Mean Herd Size and Income per Person per Day, PARIMA data, 2000-2002
Nutrition as well as income impact Mude et al., Food Policy, 2009
What is the Index Predicting? Total number of animal deaths from the Kenya sample of 180 households per round and reason cited for the death.
Creating informed Demand: The Index Insurance Game • Random Draw Initial Herd Size • Pay ‘consumption’ • Generates Bifurcating Asset Dynamics • Buy insurance • Draw idiosyncratic outcome • Draw covariate outcome • Calculate herd size change • Pay out on insurance policies if applicable • Move to new round • Each round is a rainy season dry season six month period
GameWeb for 2009 http://blip.tv/ilri/development-of-the-world-s-first-insurance-for-african-pastoralist-herders-3776231 Start at about 6:45
How Did People Play the Game • The 2008 data had been analyzed before, and is presented in an Agricultural Finance Review (2010) article. • The 2008 and 2009 were combined to be presented here. • Specification based on 2008 findings • Issues: 2009 cost more, could only be bought in even rounds, and had a different probability distribution. • Control by using price per TLU per month. • Trying to use Expected Herd growth also does not work as too much covariation with site dummy and game play parameters defined by site.
Bifurcating Asset Dynamics TLU Round of the Game
Predicted TLU Insured (y-axis) as function of game herd size (x-axis)
Implied Price Elasticity of Demand • Implied price elasticity of demand moving from 16.7 KSH per month to 62.5 KSH per month • %ΔQ=-8%, %ΔP=73%, ε=-0.073 • Chantarat finds much more elastic results, more inelastic for poorer, more elastic for wealthier in the WTP study.
Response to Lagged Game Variables TLU INSURED Shock or net % herd size change
Game Play with Personal Characteristics (site dummy results omitted)
Evidence on Sales October 2009: How many in a random sample of 924 people said they would buy insurance? 98% First round of sales in early 2010 covering March 2010 to February 2011 October 2010: How many in a random sample of 723 people did buy insurance? 35% Second round of sales in early 2011 covering March 2011 to February 2012 Currently working to manage a third round of contracts.
1 TLU (Tropical Livestock Unit)= 250 kg. liveweight =10 sheep or goats = 1 head of cattle = 0.7 camel. 15% predicted mortality ‘trigger’. Sales in Early 2010, again in early 2011
Conclusions • Really just getting going on this analysis so preliminary • Chantarat’s WTP sample has more covariates that merit comparison with game play for 2008 • 2010 repeat has actual purchases, so we can look at both WTP and Game Play predictions in contrast to what happened.
Conclusions • Major drought currently testing the product’s ability to insure against asset risk. • Behavioral responses still to be identified: • More livestock with lower risk? • Higher sales from existing herd (higher offtake rates) if need to self-insure increases herd size? • Collateral / credit constraint impact?