Download
1 / 31
320 likes | 632 Vues
Overview of FAA turbulence avoidance goals and approach. John Williams CIT Mini-Workshop July 6, 2006. Sources of Turbulence. FAA Turbulence PDT. Turbulence Forecasting Graphical Turbulence Guidance (GTG) NWP-model-based turbulence forecasts with dynamically-tuned “ensemble of experts”

E N D
Overview of FAA turbulence avoidance goals and approach John Williams CIT Mini-Workshop July 6, 2006
FAA Turbulence PDT Turbulence Forecasting • Graphical Turbulence Guidance (GTG) • NWP-model-based turbulence forecasts with dynamically-tuned “ensemble of experts” • GTG Nowcast (GTGN) Turbulence Remote Sensing • NEXRAD turbulence detection algorithm (NTDA) • Nationwide radar-based real-time detection • Other remote sensors • Satellite data • Profilers • TDWR radar • CIT avoidance guidelines • Evaluate current guidelines • Recommend alternatives • Develop “Diagnose-CIT” algorithms En-route Turbulence • Automated EDR reports from commercial aircraft • United g-load method • New Southwest/Delta method
Graphical Turbulence Guidance Product The current GTG clear-air turbulence forecast product with overlaid in situ turbulence reports from United Airlines aircraft • Operational GTG: http://adds.aviationweather.gov • Experimental GTG: http://weather.aero
Radar detection of in-cloud turbulence • NTDA performs data quality control and produces in-cloud EDR on a polar grid • To be installed on NEXRADs, ingested and mosaicked at NCEP using NSSL mosaic algorithm
Possible approach to CIT in GTG “Nowcast” (0-30 min?) NWP and satellite-based diagnostics with in situ, MDCRSnudging and dynamic tuning NWP and satellite-based diagnostics with dynamic tuning Diagnose-CIT (realtime and NWP data) Diagnose-CIT (NCWD conv. wx. forecast and NWP data) NTDA Forecast (30 min – 6 hours?)
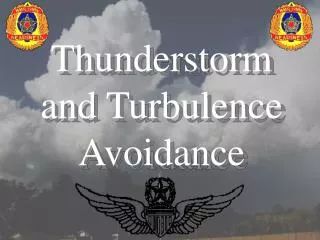
Current avoidance guidelines • Don’t attempt to fly under a thunderstorm even if you can see through to the other side. Turbulence and wind shear under the storm could be disastrous. • Do avoid by at least 20 miles any thunderstorm identified as severe or giving an intense radar echo. This is especially true under the anvil of a large cumulonimbus. • Do clear the top of a known or suspected severe thunderstorm by at least 1,000 feet altitude for each 10 knots of wind speed at the cloud top. • Do circumnavigate the entire area if the area has 6/10 thunderstorm coverage. • Do regard as extremely hazardous any thunderstorm with tops 35,000 feet or higher whether the top is visually sighted or determined by radar.
“CIT Avoidance Guidelines” task goals • Evaluate the FAA’s current thunderstorm avoidance guidelines for their effectiveness in mitigating CIT encounters • Propose alternative guidelines if appropriate • Develop CIT diagnostics module (“Diagnose-CIT”) for GTGN
Data sources • Turbulence “truth” data • In situ EDR reports from commercial aircraft • TAMDAR? • PIREPs (but may be too imprecise) • Field program data (NASA, IHOP, BAMEX, etc.) • NTSB accident cases, FDR data • NTDA EDR data? • Thunderstorm feature data • Radar data (VIL, echo tops, NSSL 3-D reflectivity, NTDA) • Lightning data (NLDN) • GOES satellite data, IR-derived cloud tops • Conv. Wx. nowcast data (NCWD, NCWF) • Aircraft data (winds, temperature, EDR) • Environment data • NWP model data and derived diagnostics
Available RUC and derived fields Turbulence Indices • Convective Parameters • CAPE • CIN • Showalter Index • Totals Indices • Lifted Index • Precipitable Water • SWEAT (Severe Wx Threat Index) • K-Index • Bulk Richardson Number • Richardson Number • Lapse Rate • DTF3 (Diagnostic TKE Formulations) • Vertical Shear • Horizontal Shear • 1/Stability • EDR (Structure Function derived Eddy Dissipation Rates) • SIGW (Structure Function derived Sigma Vertical Velocity) • Divergence • Vorticity • Dutton • NCSUI (NC State U. Index) • Colson-Panofsky • Ellrod1 • NCSUI (N.C. State U. Index) • Saturated Richardson Number • Frontogenesis Function • LAZ (Laikhman-Alter-Zalik) • NGM1 and NGM2 • ABSIA • UBF (Unbalanced Flow) • NVA (Negative Voriticity Advection) • Tropopause Height • Wind Speed
Approaches to Diagnose-CIT • Detailed case studies • Data mining based on comparisons of thunderstorm features and environment data with “truth” data (data mining = discovery of patterns or relationships through the automated analysis of data) • Improve understanding of processes involved • Build/tune automated diagnosis algorithm • Fine-scale numerical modeling of interesting cases • Feedback between these approaches
Early statistical results comparing convection to out-of-cloud turbulence
Initial results: evaluating FAA thunderstorm avoidance auidelines • For all aircraft turbulence reports over 11 months in summers of 2004 and 2005, computed • horizontal proximity to thunderstorms, indicated by NCWD VIL values (e.g., >= 3.5 kg m-2) • vertical proximity to thunderstorm tops, indicated by radar echo tops • Stratified data by proximity values • Determined frequency of different levels of turbulence in each proximity range and compared to average frequency to get “risk”
Results: Horizontal proximity Turbulence categories:
Results: Vertical proximity Turbulence categories:
“Dartboard” comparisons • Motivations • Investigate turbulence severity dependence on whether convection is upwind or downwind • Investigate turbulence dependence on intensity and size of convective activity • Approach • For each aircraft measurement, orient “dart board” based on aircraft wind direction (5-10, 10-20, 20-40, 40-80, 80-160 nmi rings, 60 wedges) • For each in situ measurement, compute • distance to convection within each wedge (convection given by NCWD VIL) • coverage by convection within wedge “rings”
Wedge orientation Wedge 0 Wedge 1 Wedge 2 Wind vector Wedge 5 Wedge 3 Wedge 4
“Dartboard” 5 10 20 40 80 160
Wedge distance to convection (alt > 20kft) Red: VIL = 0.9 kg m-2 Orange: VIL = 5 Green: VIL = 10 Lt. Blue: VIL = 15 Blue: VIL = 30 Peak EDR = 0.05 (null) Peak EDR >= 0.35 (MoG)
Wedge distance to convection (alt > 20kft) Red: VIL = 0.9 kg m-2 Orange: VIL = 5 Green: VIL = 10 Lt. Blue: VIL = 15 Blue: VIL = 30 Avg. EDR = 0.05 (null) Avg. EDR >= 0.35 (MoG)
Coverage: 5-10 nmi (alt > 20kft) Red: VIL = 0.9 kg m-2 Orange: VIL = 5 Green: VIL = 10 Lt. Blue: VIL = 15 Blue: VIL = 30 Peak EDR = 0.05 (null) Peak EDR >= 0.35 (MoG)
Coverage: 10-20 nmi (alt > 20kft) Red: VIL = 0.9 kg m-2 Orange: VIL = 5 Green: VIL = 10 Lt. Blue: VIL = 15 Blue: VIL = 30 Peak EDR = 0.05 (null) Peak EDR >= 0.35 (MoG)
Coverage: 20-40 nmi (alt > 20kft) Red: VIL = 0.9 kg m-2 Orange: VIL = 5 Green: VIL = 10 Lt. Blue: VIL = 15 Blue: VIL = 30 Peak EDR = 0.05 (null) Peak EDR >= 0.35 (MoG)
Coverage: 40-80 nmi (alt > 20kft) Red: VIL = 0.9 kg m-2 Orange: VIL = 5 Green: VIL = 10 Lt. Blue: VIL = 15 Blue: VIL = 30 Peak EDR = 0.05 (null) Peak EDR >= 0.35 (MoG)
Coverage: 80-160 nmi (alt > 20kft) Red: VIL = 0.9 kg m-2 Orange: VIL = 5 Green: VIL = 10 Lt. Blue: VIL = 15 Blue: VIL = 30 Peak EDR = 0.05 (null) Peak EDR >= 0.35 (MoG)
Learning predictive algorithm: random forests • Basic idea • “grow” multiple decision trees to predict turbulence based on “dartboard” values, each using a random subset of data (“bagging”) and random splitting variables • trees function as “ensembles of experts” • trees “vote” to determine consensus categorization; they also create a “probability distribution” over classes Vote: 4 Vote: 2 Vote: 4 Vote: 4 Vote: 1 => consensus vote: 4 (“confidence” 3/5)
Initial results (ROC curves) • Discriminate light or greater (in situ 1/3 > 0.1 m2/3 s-1) vs. null turbulence (random and biased summertime data training samples, with and without wind magnitude)
Initial results (ROC curves) • Discriminate moderate or greater (in situ 1/3 > 0.3 m2/3 s-1) vs. less than moderate turbulence
Next steps • Interpret data mining results to understand importance of different variables • Develop an “augmented in situ database” with quality-controlled EDR values, RUC model, and variables derived from RUC model data • Perform “dart board” comparisons that incorporate cloud top information for each region, use RUC model winds for orientation, and incorporate augmented in situ data • Add temporally-lagged data to the analysis • Incorporate thunderstorm “objects” and features • Use results from case studies and simulations to modify/refine approach
Challenges • Large number of data sources • Analysis/tracking/extrapolation/feature identification from multiple 4-D data fields required • “Curse of dimensionality” • In situ EDR data not ideal “truth” • Many different sources and conditions, and their interactions, cause observed turbulence • Aircraft data are not representative samples of the atmosphere • Need additional data sources • “echo tops” data are only to nearest 5,000 ft • object information (size or severity) of nearby storm • history and track of the storm? • environmental conditions that may affect propagation of turbulence, breaking of “gravity waves” • Need physical basis for narrowing down fields/features toinclude in analysis